My friend @hettalentctc asked me to chart some #DeFi coins he is interested in. Full thread with 13 DeFi coin charts!
I often do personalized chart requests in @TheBirbNest Interested in more charts? Sign up for a 7-day free trial at https://www.thebirbnest.com/
I often do personalized chart requests in @TheBirbNest Interested in more charts? Sign up for a 7-day free trial at https://www.thebirbnest.com/
Note before I start. I tried my best to apply Technical Analysis on these charts, but it can be hard since most DeFi coins are low volume, low liquidity coins. Levels mentioned should be interpreted with a margin for error. I picked the USD chart unless mentioned otherwise.
In most analysis I use the On-Balance Volume (OBV) indicator in these charts since volume is important. Fading volume in DeFi coins means fading interest.
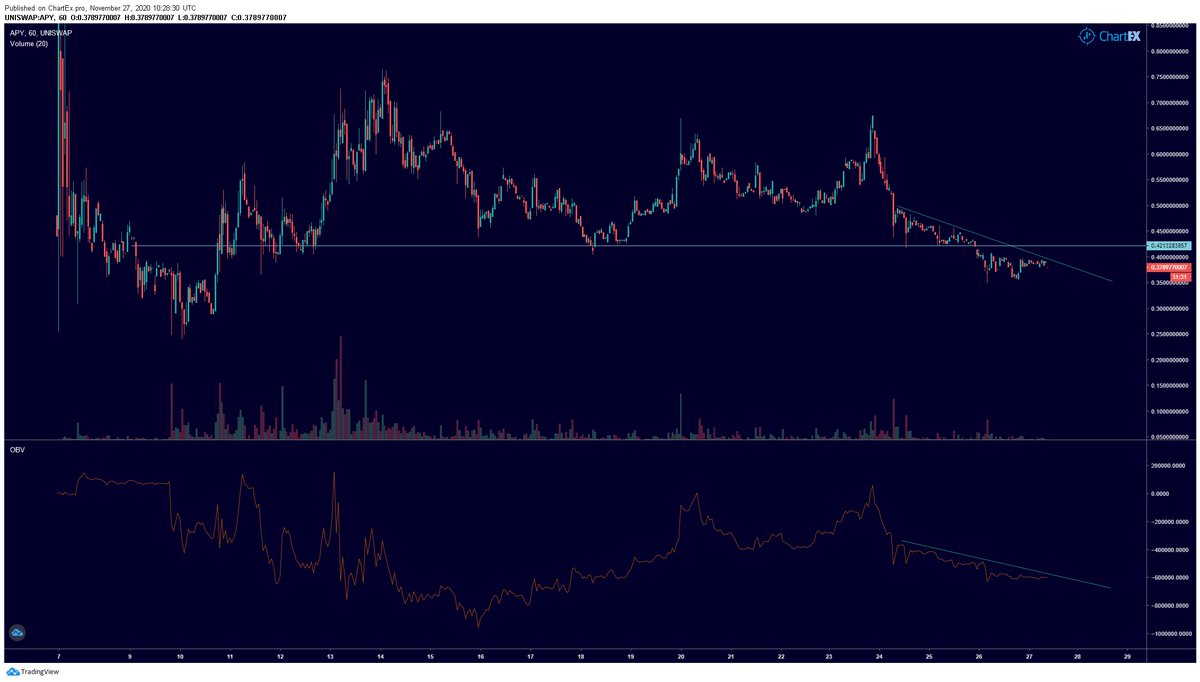
$API has fallen below support at 0.42 and is in a downtrend. OBV also shows a decline in volume. Bearish until price can break the trendlines or retake 0.42
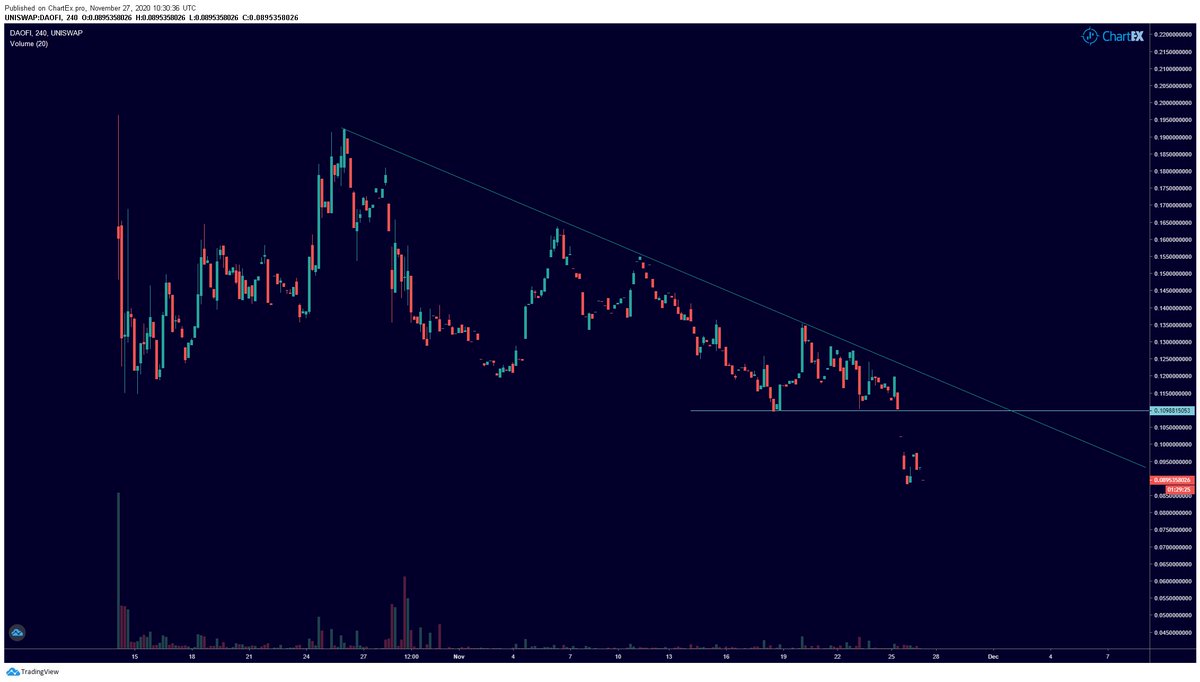
Fading volume on $DAOFI and price declining below the trendline. Especially bearish after it broke 0.11. It needs to retake that level and break the trend line to be bullish.
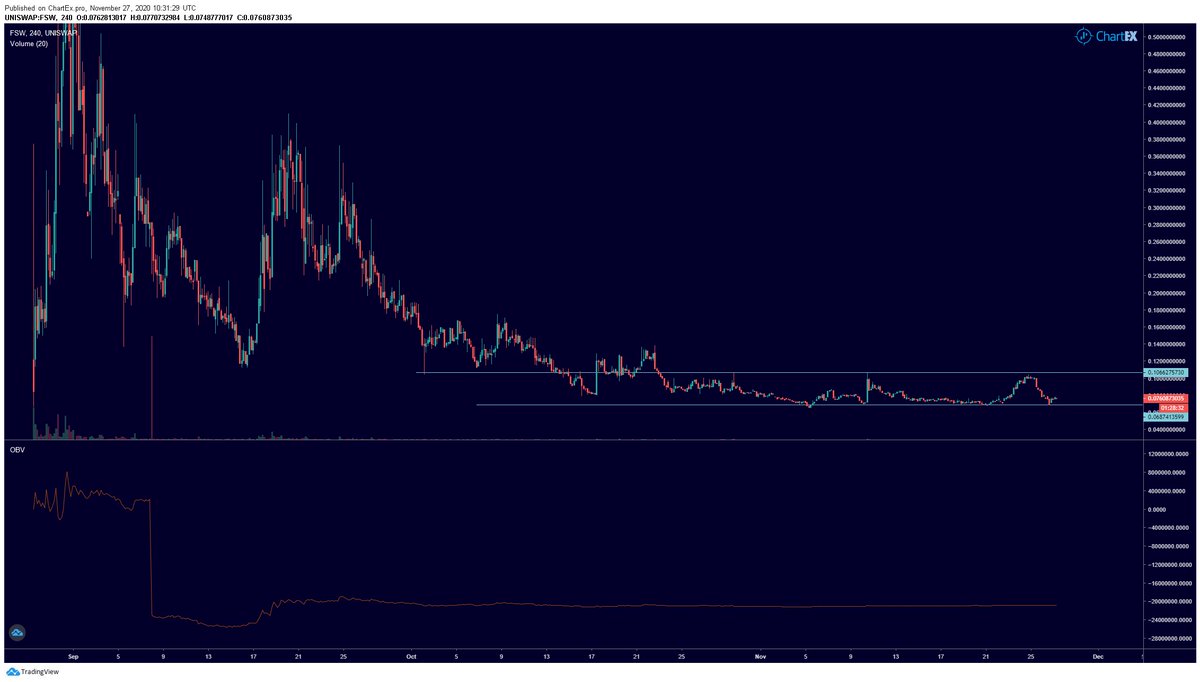
$FSW, a chart that is similar to most #DeFi coins. Volume and volatility near the listing but then fading interest. Price is now ranging between 0.068 and 0.106. Break up with some volume and it is bullish. Otherwise, I expect more sideways action and loss of interest
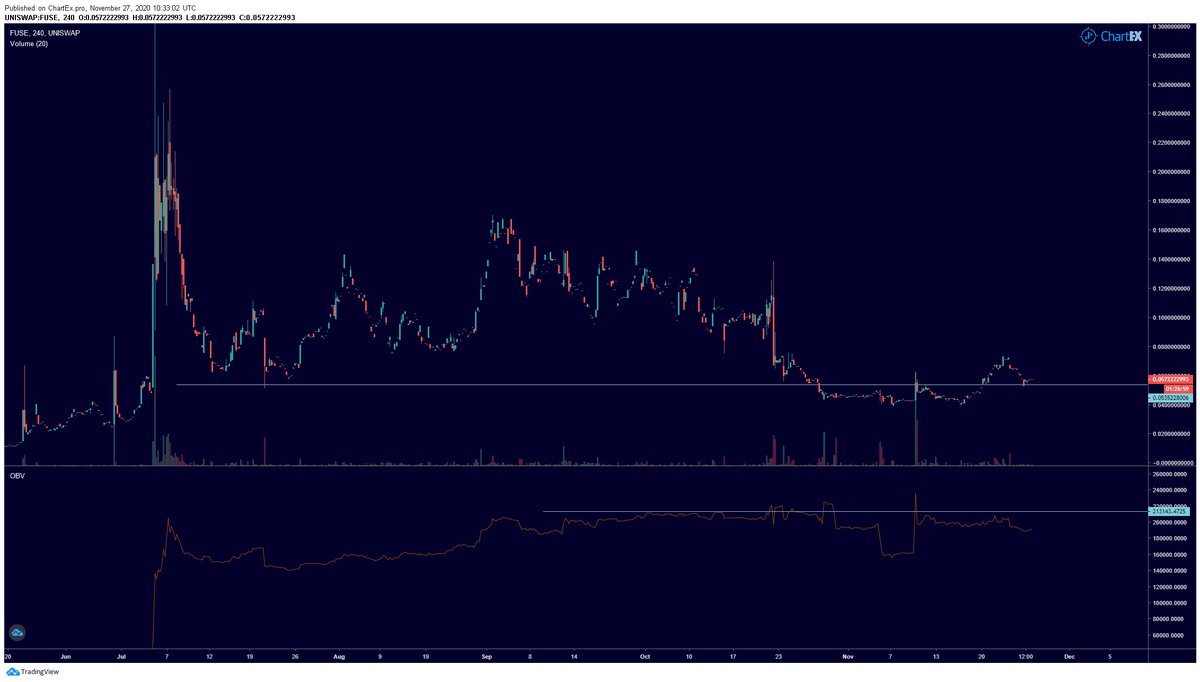
$FUSE has retested the level of 0.053, which price has been consolidating below. If it can hold here I can see more upside. Would be better if OBV could break the 213142 to show there is genuine interest in this coin
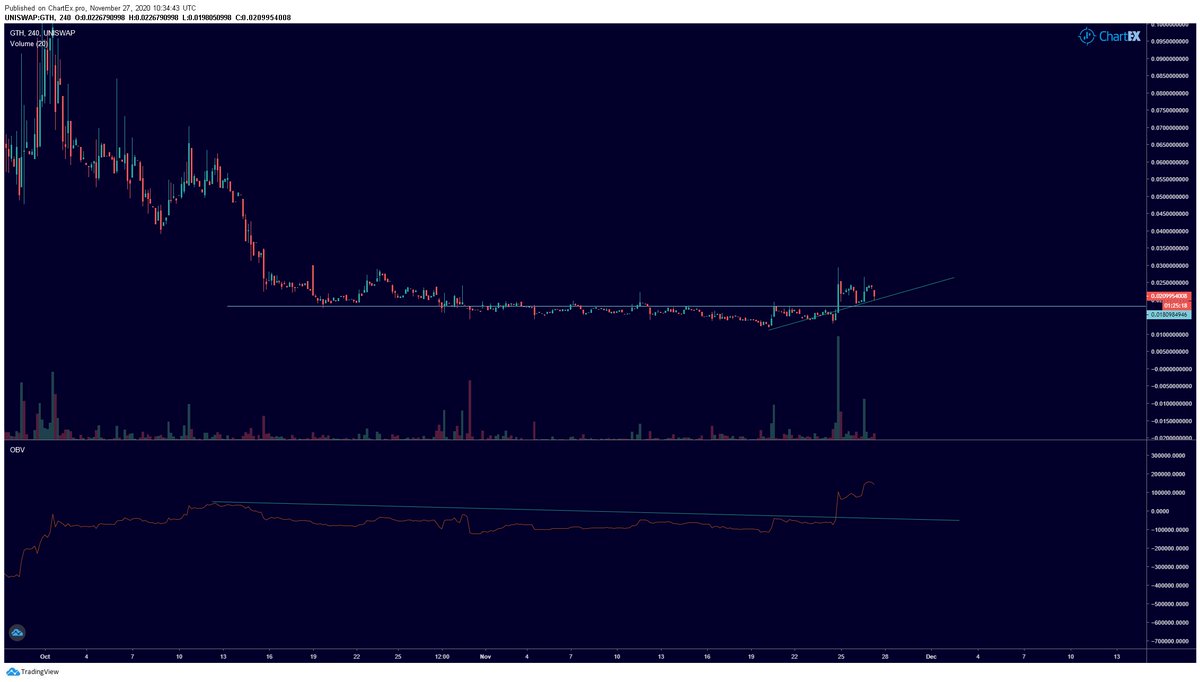
$GTH is what you want to see if you have been holding this coin. Break of 0.018 and now trying to form an uptrend. The break of the trendline on OBV looks also bullish. Volume is clearly increasing. This coin might have bottomed
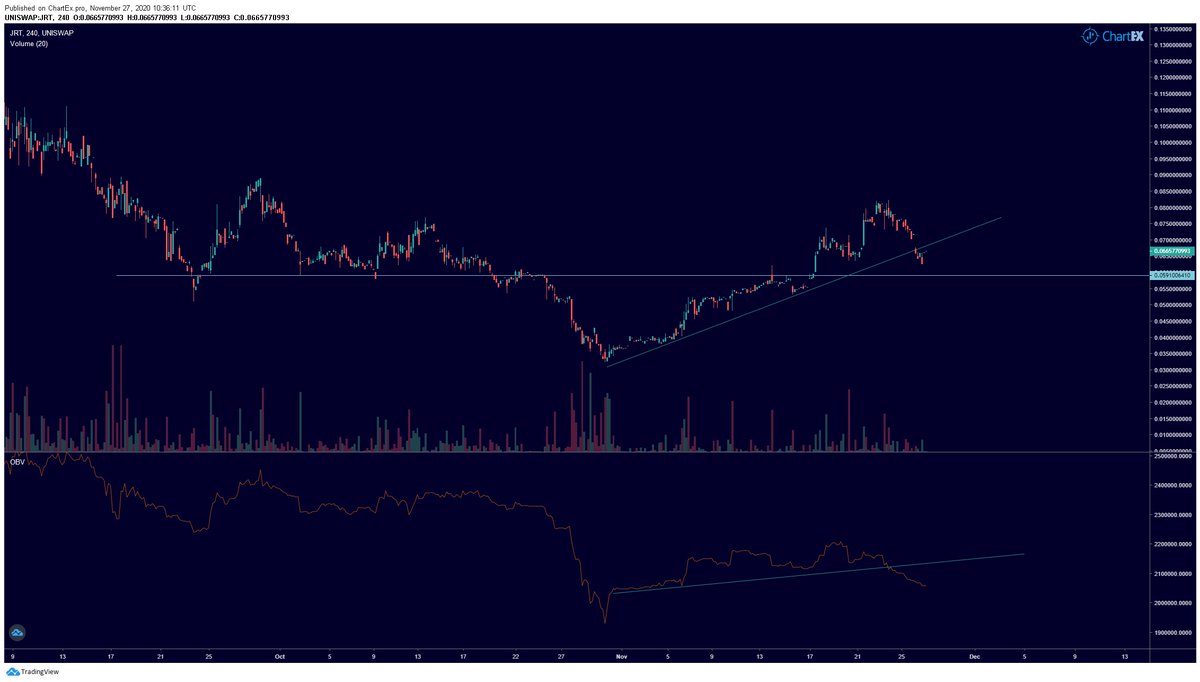
$JRT was forming a nice uptrend but broke that one after a break of the trendline in the price and OBV chart. Neutral outlook now but it needs to stay above 0.059. Bearish if it breaks down.
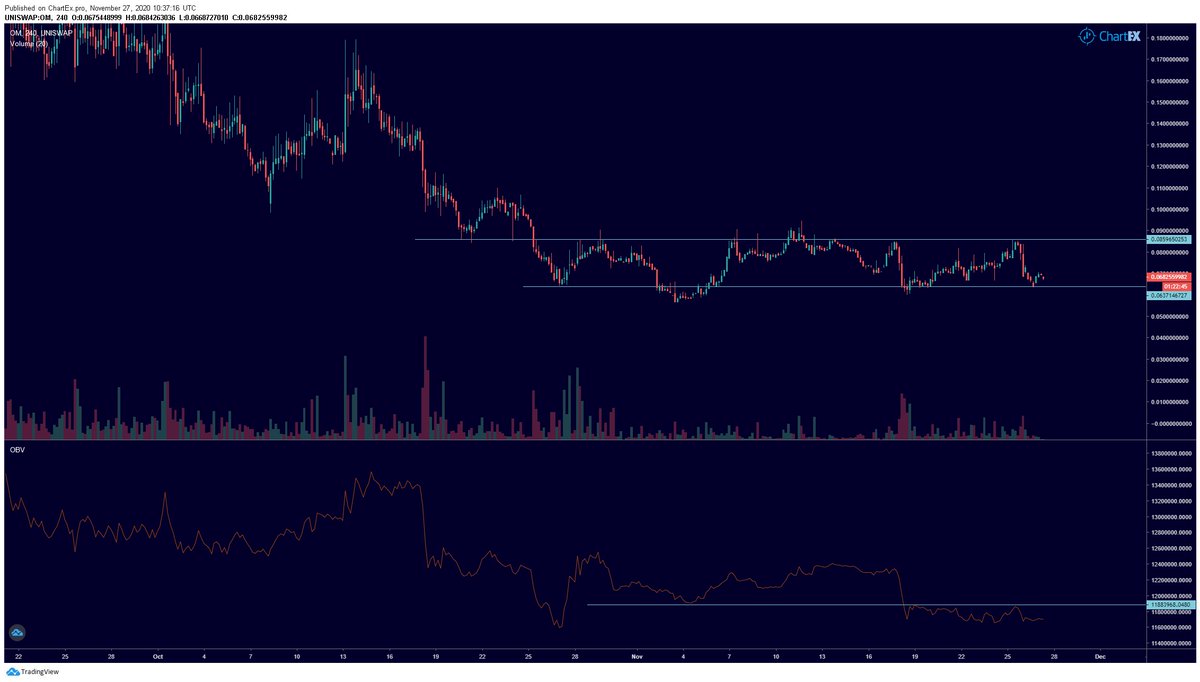
$OM has been in this range going sideways. Looking neutral until it can break the range to the upside or downside.
First bearish indication is OBV dropping
First bearish indication is OBV dropping
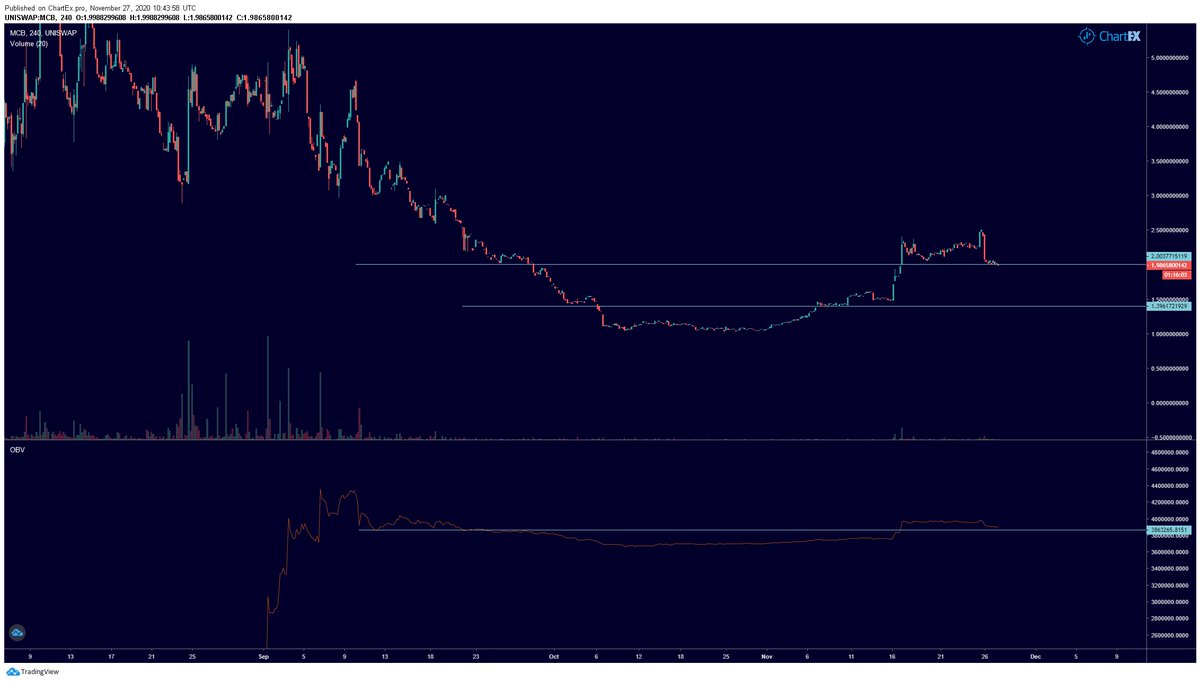
$MCB looking fairly bullish. Retaking two supports with the last one at 2. OBV also getting above a resistance. If it holds here 3 is the next target
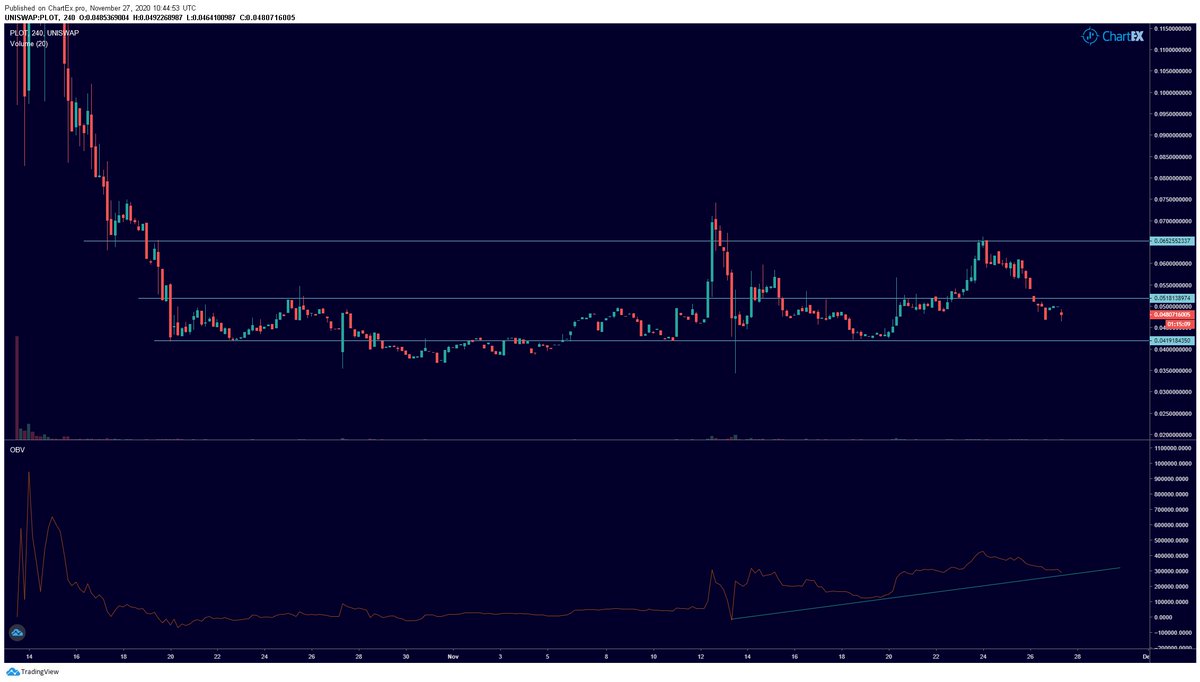
$PLOT is ranging between 0.041 and 0.065. It's interesting that OBV is going up while price is staying at these levels. Best would be first a break of 0.051 and then 0.065. That would be the best bull scenario
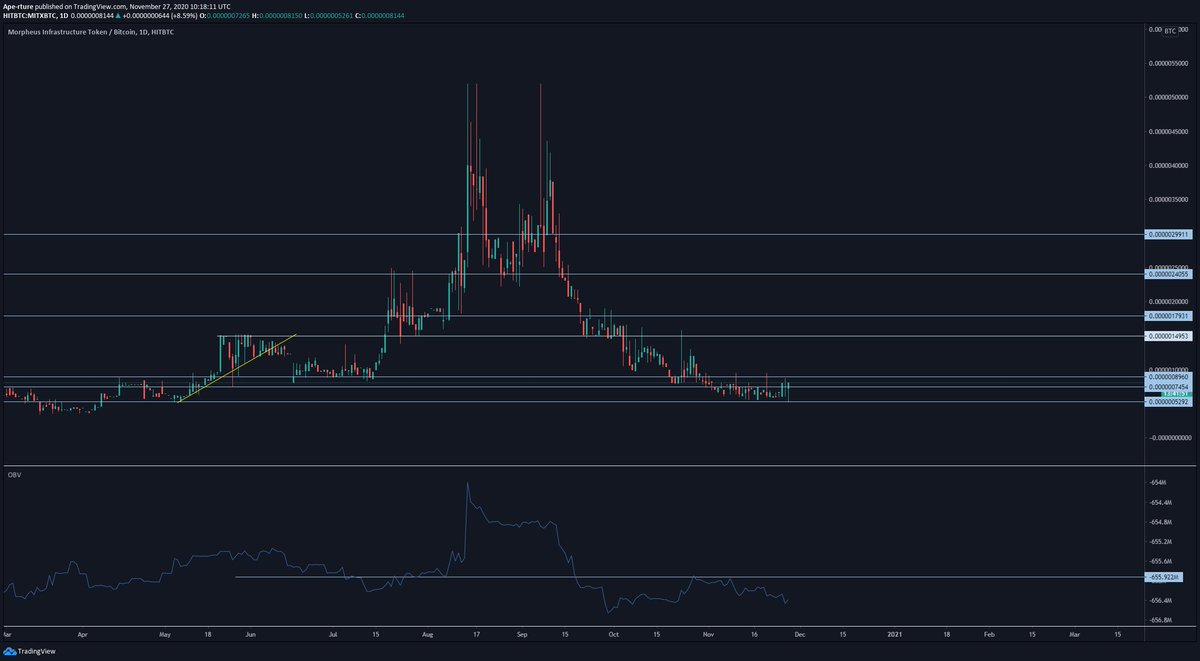
$MITX on the $BTC pair. Price is below 8960 but it's consolidating here. If it can retake that resistance I think price can reach 15000 as the first target butt rend continuation possible if it starts breaking these resistances.
OBV has to go above -655M for this to happen.
OBV has to go above -655M for this to happen.
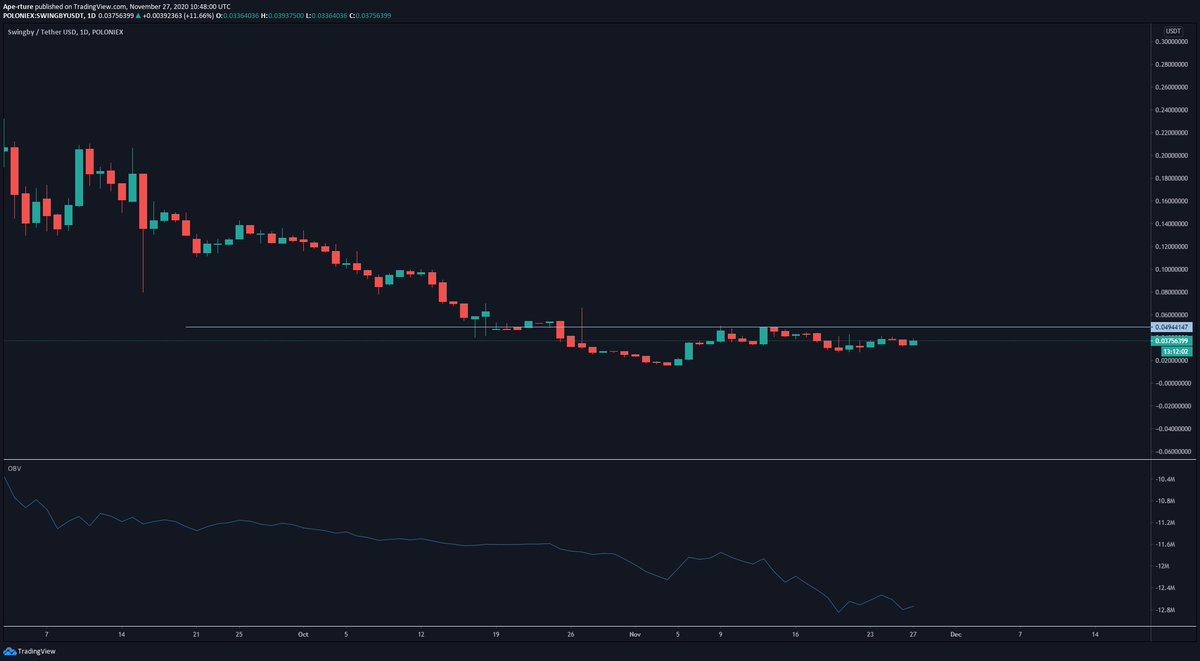
$SWINGBY USDT looks fairly dead here. Typical dump on exchanges by early investors chart. Needs to get above 0.05 for any bullish action but OBV sloping down. First needs some volume
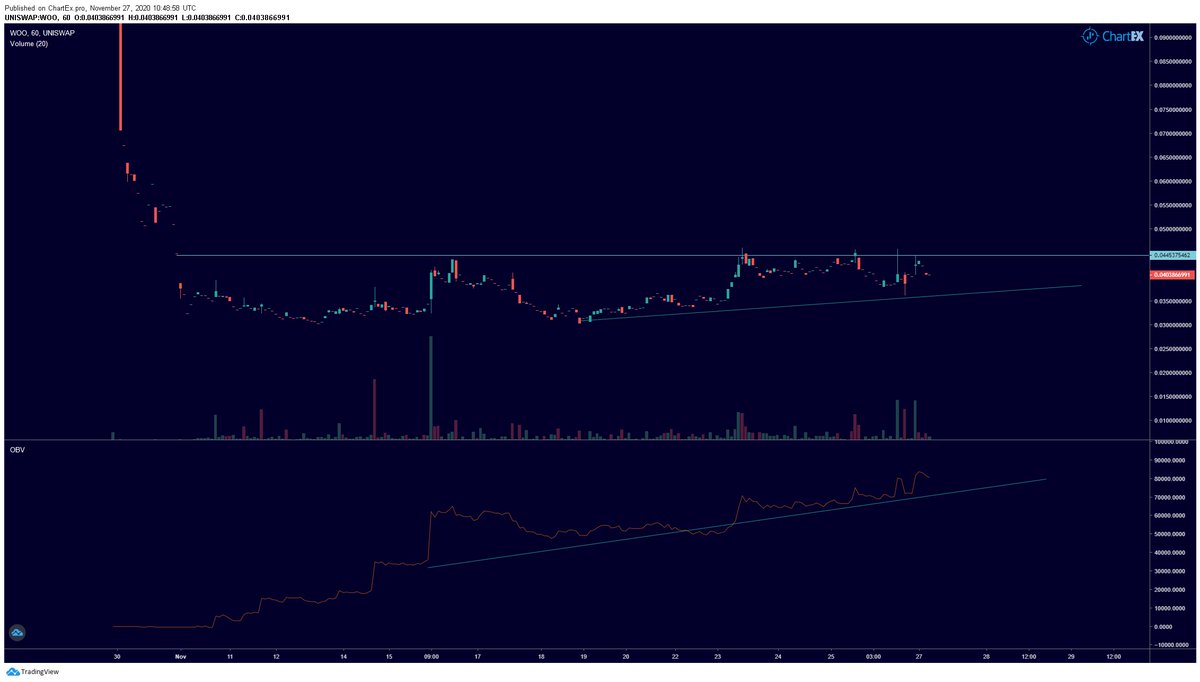
Fairly bullish chart on $WOO. Holding the trendline and OBV also going up. Very bullish if it can break 0.044
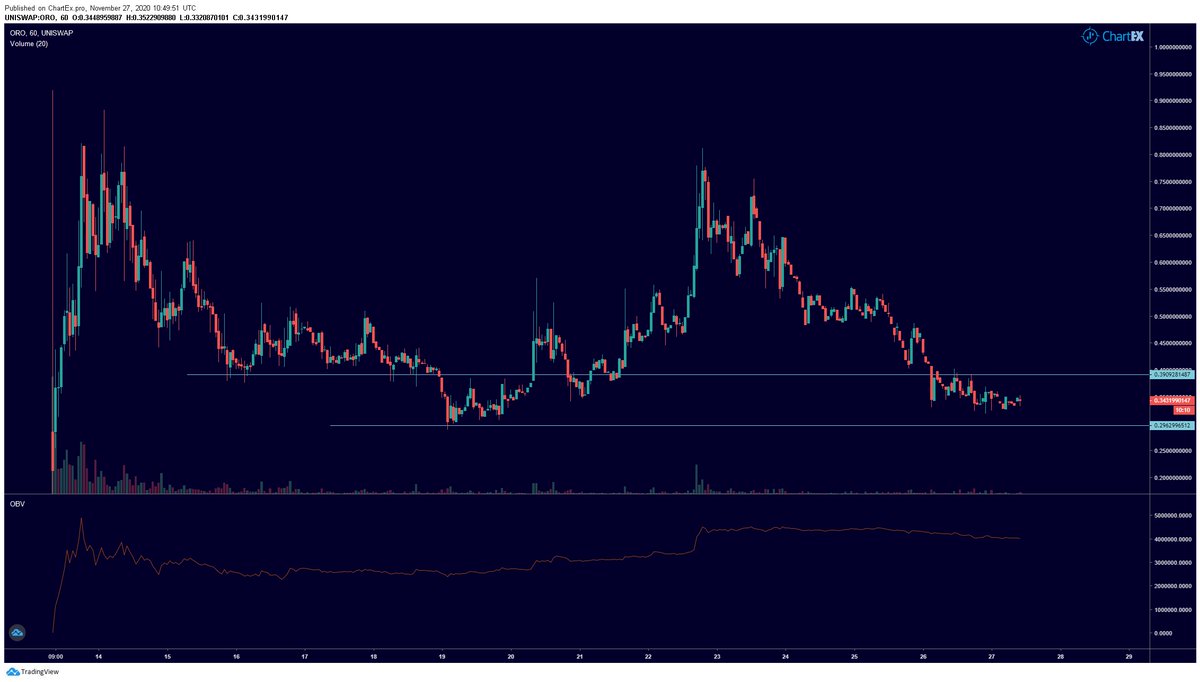
$ORO back in a range. Neutral here. Break 0.39 for a bull case, break 0.03 for a bear case
@hettalentctc I left out the charts that weren't interesting to chart. That means too much sideways price action, too much noise or I couldn't find a chart. These charts are:
$CNTR
$HTR
$GIV
$ZEE
$CNTR
$HTR
$GIV
$ZEE
Feel free to drop you questions below the individuals charts. I'll gladly answer them.
If you want to have more advice on trading crypto make sure you check out our Black Friday sale. We provide daily support and advice to crypto traders.
https://www.thebirbnest.com/black-friday
https://www.thebirbnest.com/black-friday

 Read on Twitter