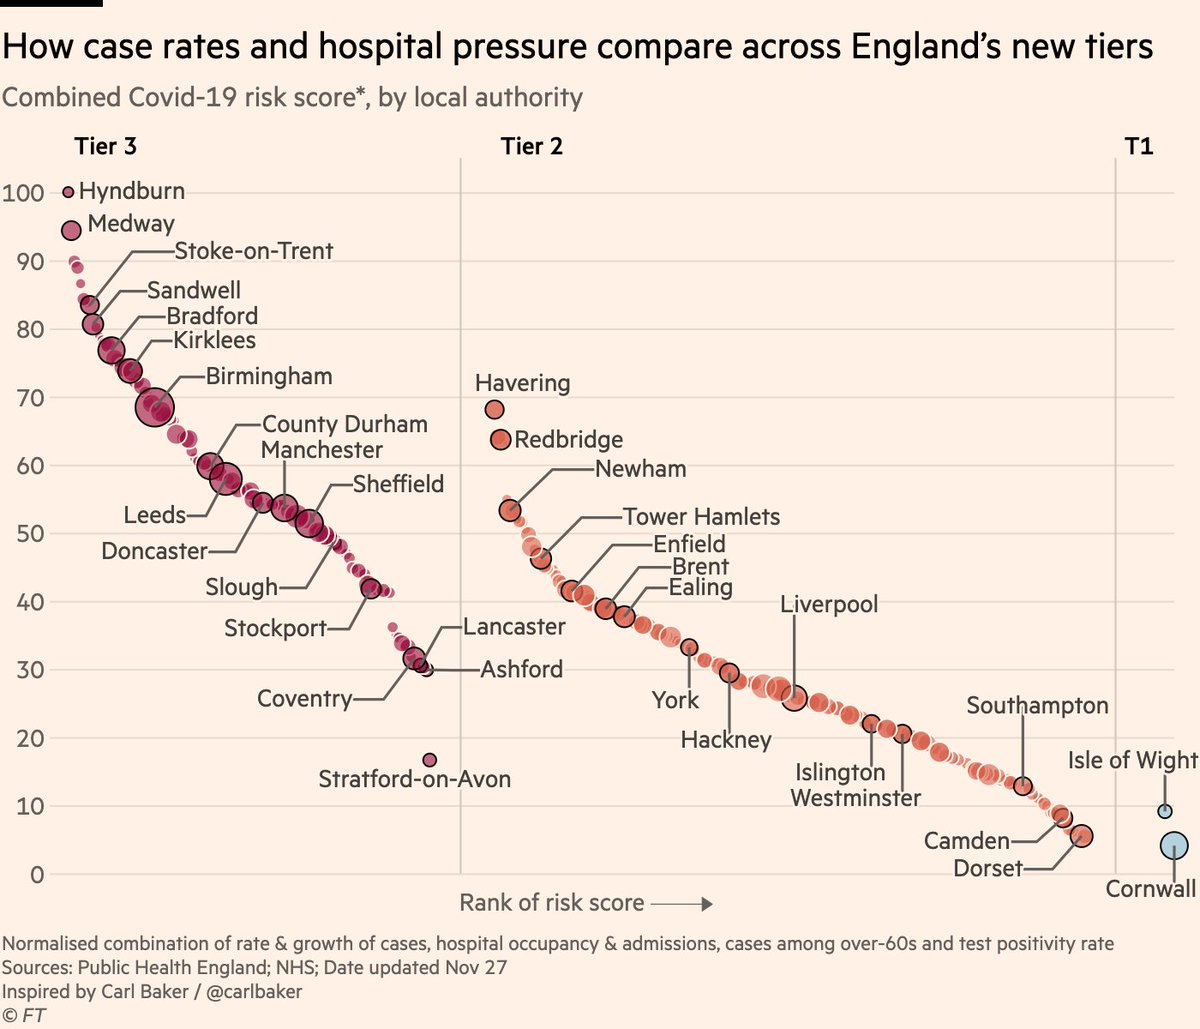
NEW: here’s the definitive chart on which parts of England have been hard-done-by or "let off" by the new tiers.
This one combines all the metrics the govt says it’s using:
• Cases (overall rate, rise or fall, and over-60s)
• Hospital occupancy & admissions
• Positivity rate
This one combines all the metrics the govt says it’s using:
• Cases (overall rate, rise or fall, and over-60s)
• Hospital occupancy & admissions
• Positivity rate
In summary:
• Tiers seem correct for majority of places. All high-risk areas are in highest tier
• "Harsh" decisions like Stratford typically areas whose neighbours have high risk
• Outer London has been "let off", but difficult to have outer & inner London in different tiers
• Tiers seem correct for majority of places. All high-risk areas are in highest tier
• "Harsh" decisions like Stratford typically areas whose neighbours have high risk
• Outer London has been "let off", but difficult to have outer & inner London in different tiers
The question some might ask is:
If places like Stratford were bumped up a tier because of high risk in surrounding areas, why was inner London not bumped up to tier 3 where parts of outer London appear to belong?
I think there are valid reasons, but it’s worth pondering.
If places like Stratford were bumped up a tier because of high risk in surrounding areas, why was inner London not bumped up to tier 3 where parts of outer London appear to belong?
I think there are valid reasons, but it’s worth pondering.
I’ll be getting into more detail with @adamboultonSKY at 11:45 this morning
In the spirit of transparency, here is all the raw data (and combined score): https://docs.google.com/spreadsheets/d/1Y_ryQWzjOYZR2F3g6dI1xyGKFhJZWARCH7TXxWGYzM8/

 Read on Twitter


