Something rather strange is happening with the COVID-19 statistics produced by the Turkish Ministry of Health. (Thread)
/1
/1
Turkey's daily numbers are available, with English-language column captions, in English at this web page. https://covid19.saglik.gov.tr/EN-69532/general-coronavirus-table.html
/2
/2
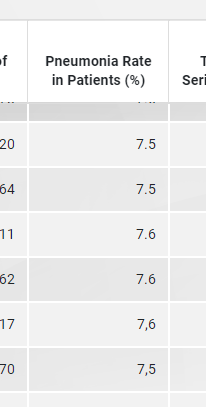
Just as an aside, there are inconsistencies in the formatting. The decimal separator for the % of patients with pneumonia varies between a comma & a period, suggesting that the data on the web page may come from a manually-maintained spreadsheet rather than a database report. /3
I copy/pasted the table of numbers from the web page to a text file, cleaned it up a bit, and put it into Excel. The good news is that the daily differences between the "total" columns (on the left) are indeed equal to the daily numbers from the right. /4
However, if you look closely at the daily numbers, you might notice something. Almost none of them end in zero. Yet, these are mostly quite big numbers. The last digit of, say, a number of tests in the tens of thousands surely ought to be random. /5
The most famous bit of Benford's Law tells us something about the first digits of unbounded decimal numbers, but it turns out that Benford also predicts that the 3rd and subsequent digits will be uniformly distributed. The 2nd will be *mostly* uniform; I'll come back to that. /6
This lack of zeroes is noticeable to the naked eye for all four daily counts: cases ("Patients"), tests, deaths, and recovered patients. In the last 24 days, for example, only one out of 96 numbers has ended in zero. /7
We can run a simple statistical test whether the distribution of the last digits of each of these numbers is uniform. Here's what I got when I did that. /8
For those who don't read test statistics very often: With 10 possible digits and an expected uniform distribution, a chi-square statistic above 20, or a p value below .01, is starting to be an indication that something unusual is happening. So these numbers are *very* unusual. /9
In the case of deaths, it might be objected that most of the numbers are less than 100, so what we're testing is often the 2nd digit, not the 3rd (as I mentioned above). But even so, the numbers are strange, because (a) there are lots between 10 & 20 but none under 10, and... /10
(b) the more common last digits for deaths are 7, 8, and 9, whereas a "Benford 1st-digit hangover effect" would predict more 1s and 2s. /11
Indeed, this effect (more 7s, 8s, and 9s) is especially pronounced in the daily death numbers below 30 (accounting for 100 days in total) /12
I have no idea what all of this means, but it does seem somewhat unlikely that these numbers are entirely the product of natural processes. Perhaps some artefact of the data collection protocols is causing this. /13
I have posted my code here https://gist.github.com/sTeamTraen/8c2c4a01b293f64f29cfec70c09436e7 so that you can check my analyses. That also has a link to a copy of the data, if you don't want to go through the hassle of capturing it from the web site yourself. /14 /end

 Read on Twitter


