MONTGOMERY
**EXPLOSIVE: a 95%-Biden batch of 90,022 mail/absentee votes is statistically impossible and looks nothing like any other batch of votes --- in the country **
**
By @DarrenJBeattie

**EXPLOSIVE: a 95%-Biden batch of 90,022 mail/absentee votes is statistically impossible and looks nothing like any other batch of votes --- in the country
 **
**By @DarrenJBeattie

MONTGOMERY
The new batch of mail ballots voted 95.4% for Biden and 3.7% for Trump, whereas previously reported mail ballots voted 74.9% for Biden, and 24.4% for Trump.
It is statistically impossible that these two batches came from the same distribution.

The new batch of mail ballots voted 95.4% for Biden and 3.7% for Trump, whereas previously reported mail ballots voted 74.9% for Biden, and 24.4% for Trump.
It is statistically impossible that these two batches came from the same distribution.

MONTGOMERY
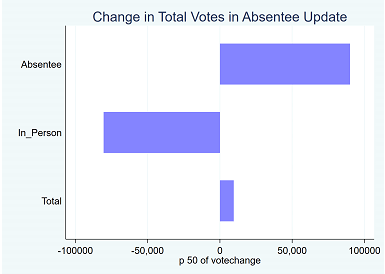
Mail votes increase by 90,022, but total votes increase by only 9,534 votes. The number of in-person votes thus decreases by 80,488 (98.1% decrease for Biden).

Mail votes increase by 90,022, but total votes increase by only 9,534 votes. The number of in-person votes thus decreases by 80,488 (98.1% decrease for Biden).

MONTGOMERY
In the new mail ballot batch, the Libertarian candidate Jo Jorgensen receives 20.0% as many votes as Trump. If Democrat voters are ignored, the new batch comes from a group of people who would be the second strongest Libertarian-supporting county in the entire US.

In the new mail ballot batch, the Libertarian candidate Jo Jorgensen receives 20.0% as many votes as Trump. If Democrat voters are ignored, the new batch comes from a group of people who would be the second strongest Libertarian-supporting county in the entire US.

MONTGOMERY
The distributions of ballots run 98.1% Biden, 1.5% Trump, and 0.8% Jorgensen which look nothing like either the previous mail in ballots, OR the previous in-person ballots. This makes it very difficult to believe that these were genuine ballots.

The distributions of ballots run 98.1% Biden, 1.5% Trump, and 0.8% Jorgensen which look nothing like either the previous mail in ballots, OR the previous in-person ballots. This makes it very difficult to believe that these were genuine ballots.

MONTGOMERY
The mail ballots had been 74.9% for Biden, 24.4% for Trump, and 0.7% Jorgensen.
Of the 90,022 new votes, 95.4% were for Biden, 3.7% were for Trump, and 0.9% were for Jorgensen.
In other words, Biden's vote share went up 20.5%, while Trump's went down 20.7%.

The mail ballots had been 74.9% for Biden, 24.4% for Trump, and 0.7% Jorgensen.
Of the 90,022 new votes, 95.4% were for Biden, 3.7% were for Trump, and 0.9% were for Jorgensen.
In other words, Biden's vote share went up 20.5%, while Trump's went down 20.7%.

MONTGOMERY
Biden’s 2020 total vote in Montgomery is reported at 313,000, crushing Obama’s 233,000 take in 2012 – and population growth does not explain the gains, as the county only grew by 22,000 residents during those eight years

Biden’s 2020 total vote in Montgomery is reported at 313,000, crushing Obama’s 233,000 take in 2012 – and population growth does not explain the gains, as the county only grew by 22,000 residents during those eight years

PENNSYLVANIA
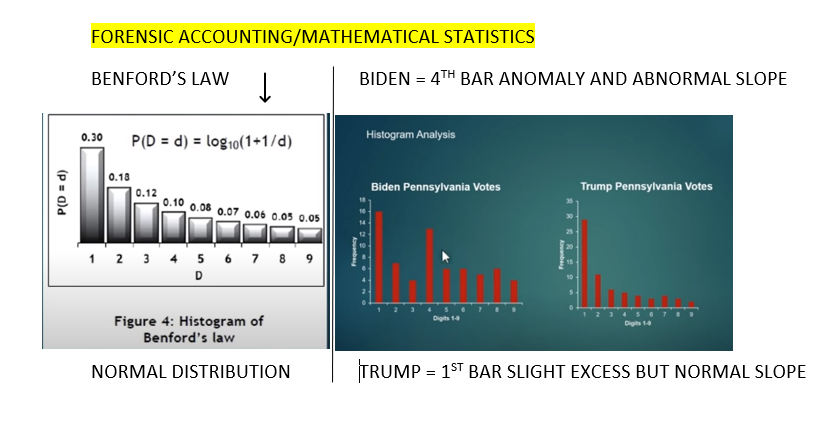
Using forensic analysis and applying Benford's Law to all 67 counties in Pennsylvania, Biden's 4th bar is anomalous, suggesting data manipulation, while the slope of the curve is normal for Trump.

Using forensic analysis and applying Benford's Law to all 67 counties in Pennsylvania, Biden's 4th bar is anomalous, suggesting data manipulation, while the slope of the curve is normal for Trump.

MONTGOMERY
All mail ballots in Montgomery County were instructed to be mailed to the same postal address. This strengthens the reasons for believing that mail ballots should be drawn from roughly the same distribution.

All mail ballots in Montgomery County were instructed to be mailed to the same postal address. This strengthens the reasons for believing that mail ballots should be drawn from roughly the same distribution.

MONTGOMERY
The challenge is not coming up with an explanation that covers one or two of the above listed facts, but an explanation that covers all of them. It is absolutely statistically impossible that these two ballots represent draws from the same underlying distribution.

The challenge is not coming up with an explanation that covers one or two of the above listed facts, but an explanation that covers all of them. It is absolutely statistically impossible that these two ballots represent draws from the same underlying distribution.


 Read on Twitter


