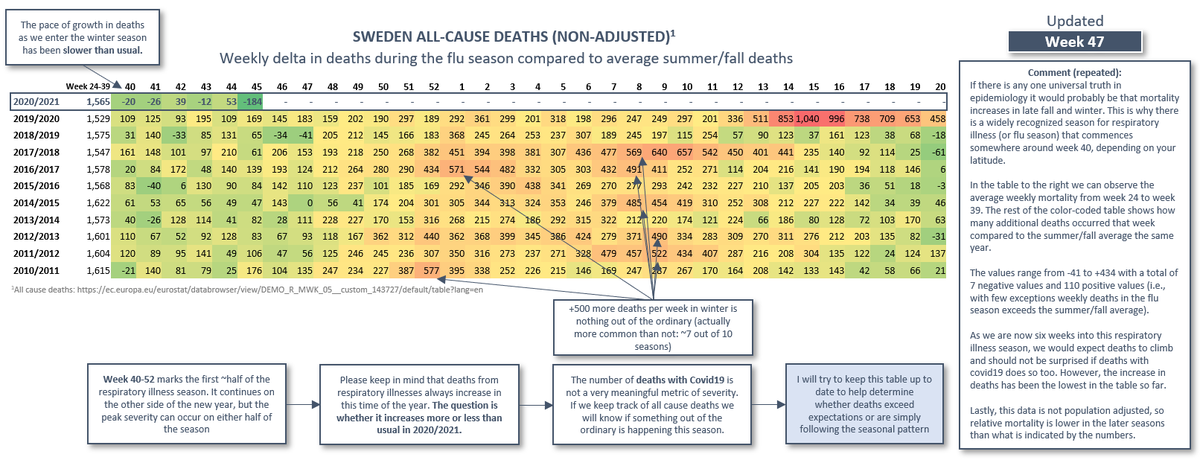
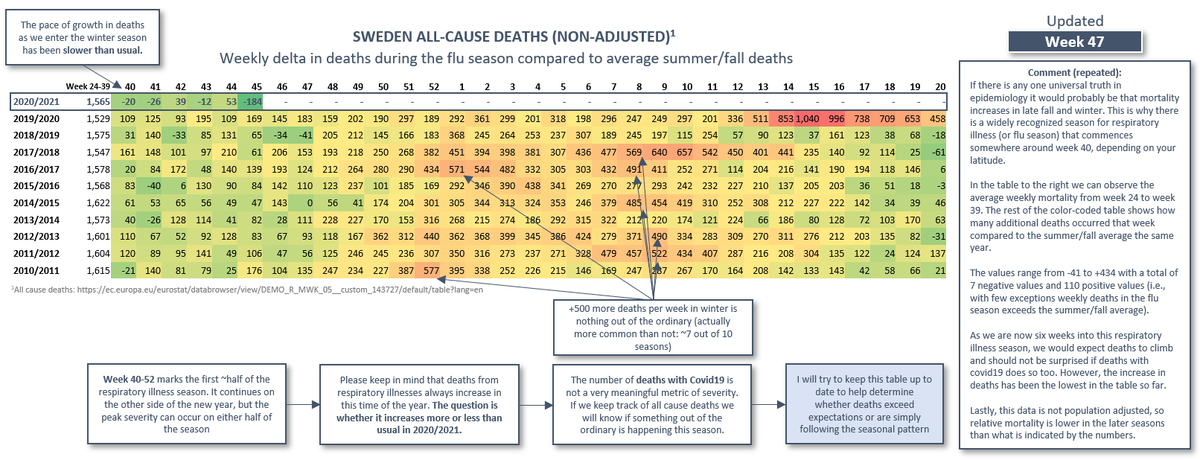
0/17 Sweden. New series of weekly updated tables to track whether the increase in mortality this winter is in line with respiratory illness seasonality, or something extraordinary. So far (week 40-44) mortality has increased unusually slowly this winter. First some background:
1/17 When cases began to climb a few weeks ago it was a textbook exhibit of respiratory illness seasonality. I was surprised that many acted as if this was surprising. Others seemed a bit too eager at the prospects of redeeming their outsized mortality forecasts from spring.
2/17 Yet, despite repeated claims that a spring-like situation was just around the corner, mortality has seemed to behave differently this time. Furthermore, eyeballing the data it didn’t even seem as if the gradual uptick in deaths was unusual for this time of the year.
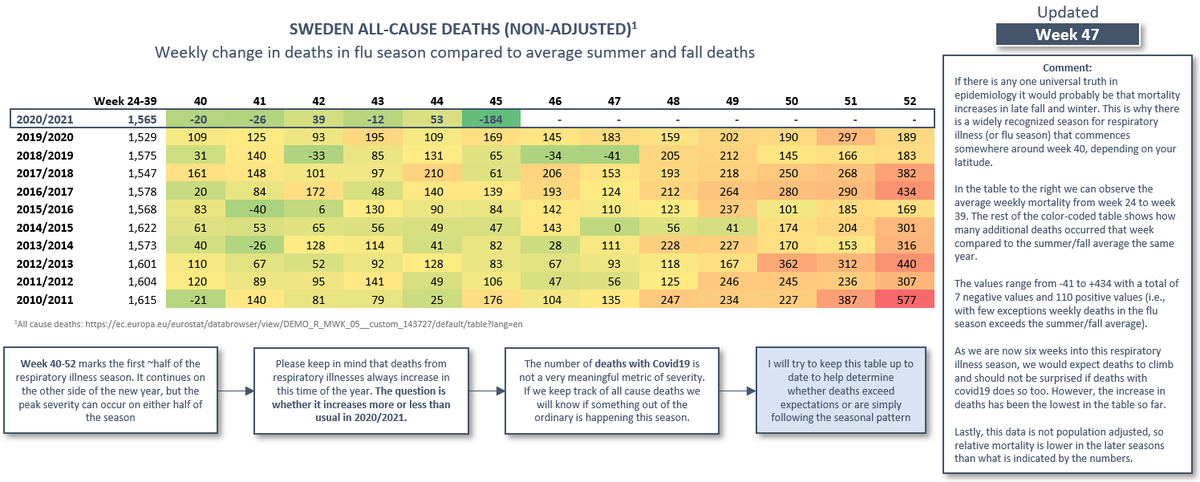
3/17 Unlike in spring, the newfound sense of doom has seeped all the way into the Swedish government. The shift in tone was genuinely worrying, and I needed to know if it was founded in objective data analysis, or not. I made 3 new tables to help track the development as we go.
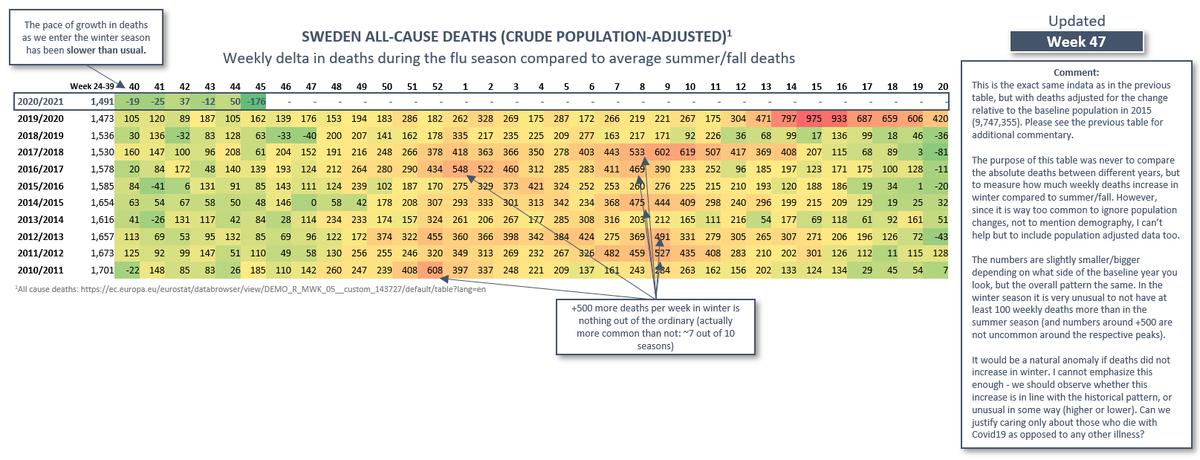
4/17 Table 1. When compared to the average weekly deaths throughout summer/fall (non-adjusted), the absolute increase in weekly deaths has been among the slowest on record so far (we can disregard the last 2 weeks due to reporting lag).
5/17 Just as every preceding year (likely ever), mortality will increase gradually throughout the winter. If we don’t start relating the seasonal increase in mortality to historical seasonality patterns, the misinterpretations of the data will only get worse. Much worse.
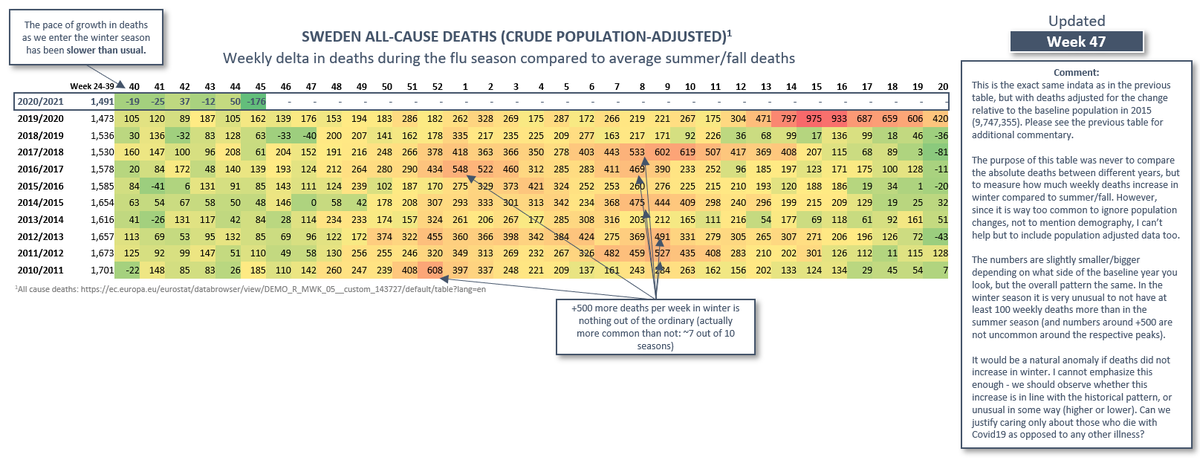
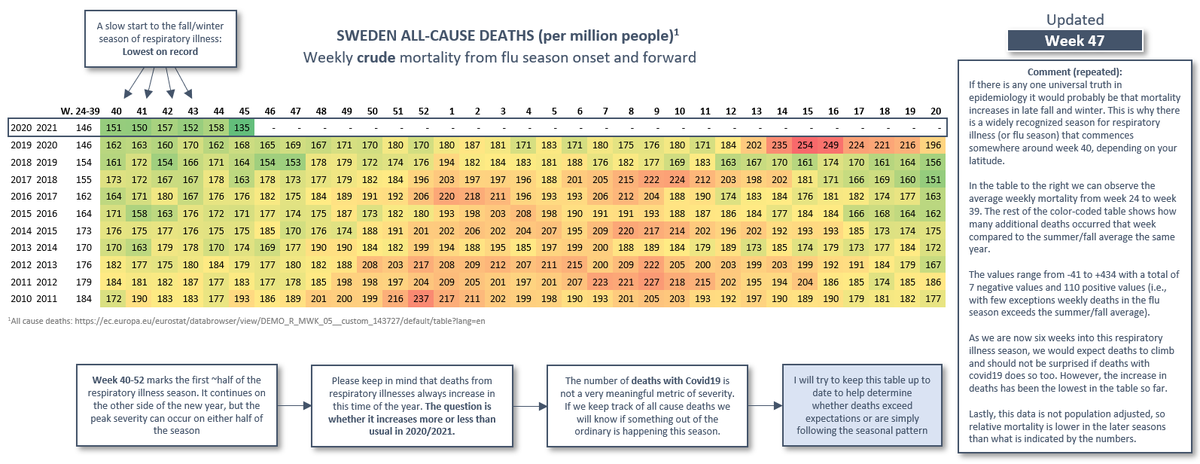
6/17 Table 2. Mortality usually peaks in the weeks after new year. If the other viruses that cause respiratory illness only make a marginal contribution to mortality this winter, we could have 100’s of Covid19 deaths per week and still end up within “normal” ranges for mortality.
7/17 Imagine if we climb to 500 deaths per week with covid19 somewhere around new year. If we don’t provide the overall mortality perspective this could provoke harmful policy decisions with far reaching net-negative consequences for public health.
8/17 Instead of showing the increase in mortality in winter compared to summer/fall, this table shows crude adjusted mortality per million people (note, it’s still CRUDE adjusted mortality, i.e. not corrected for demography).
9/17 The table clearly depicts how we’ve had the slowest increase in mortality this respiratory illness season in the past ten years (so far). Remember that we can safely ignore the last two weeks of data, but beyond that the retroactive adjustments seem to be minor.
10/17 As you hopefully know by now. Crude age adjusted mortality is called crude for a reason. To make a meaningful comparison we should control for changes in demography (this is not my idea, but standard practice, se link for one example). https://www.who.int/data/gho/indicator-metadata-registry/imr-details/78
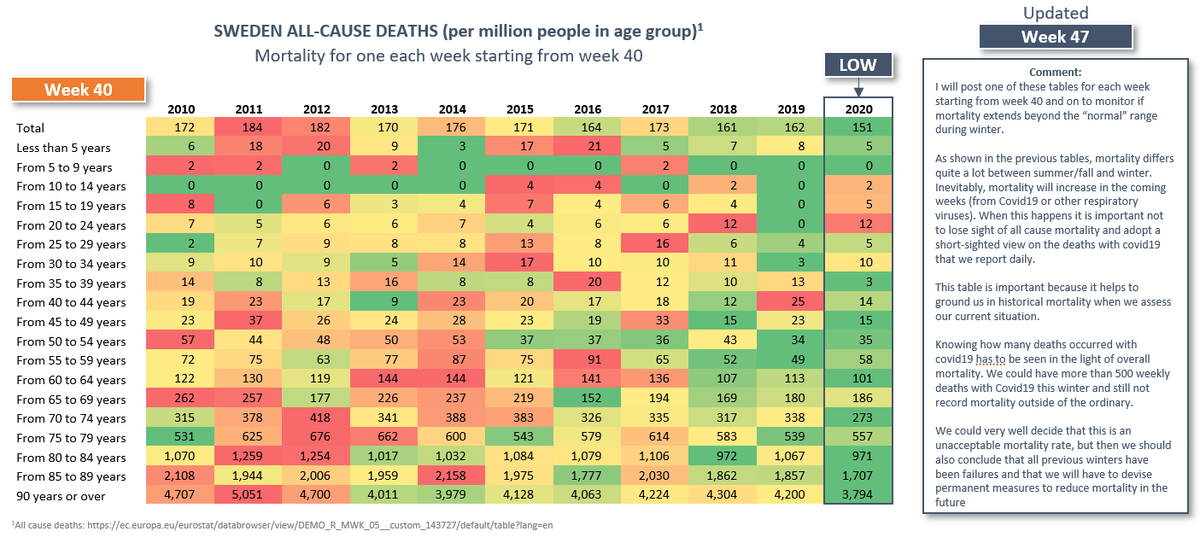
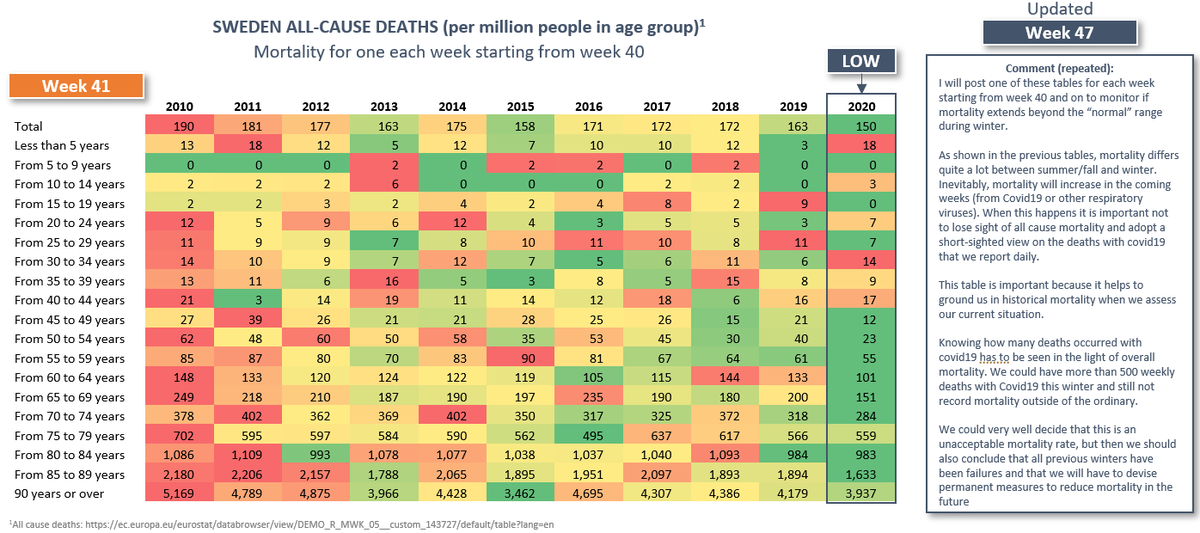
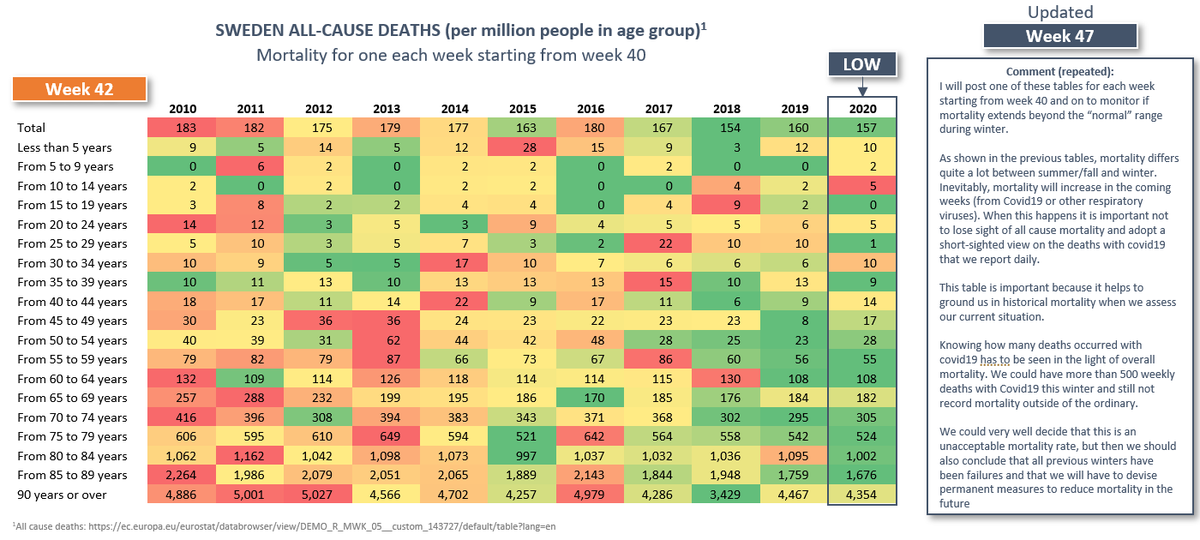
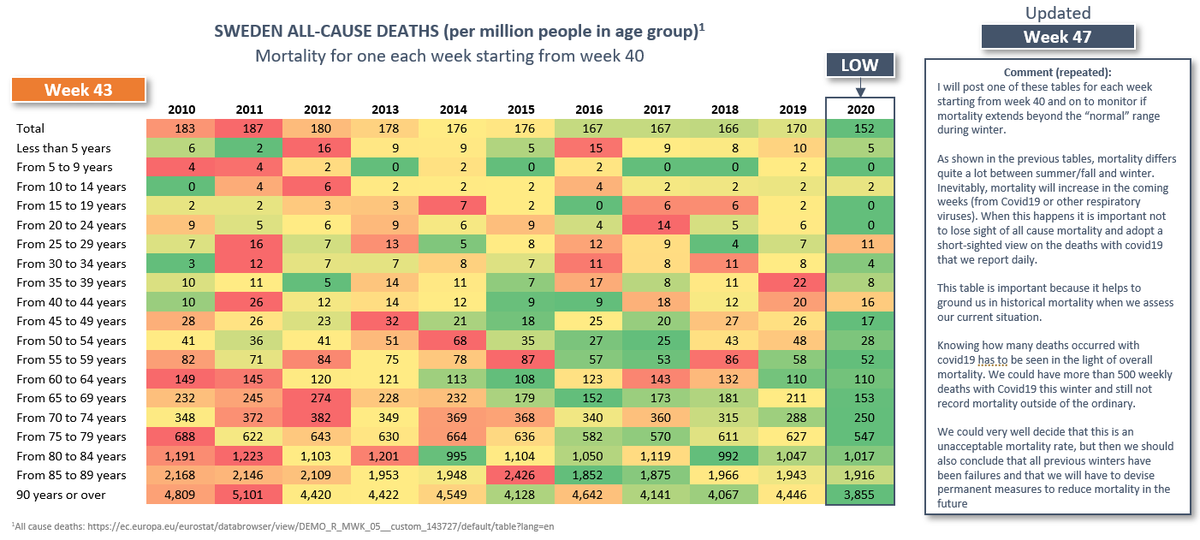
11/17 In the following four tables we look at mortality across all the 5-year age groups available from Eurostat. I will post new diagrams weekly to see if mortality remains below “normal” levels as the natural respiratory illness seasonality progresses in the coming weeks.
12/17 Since we have a backlog of ~4 weeks with reliable data we can already tick off week 40-44. Next update will only include an updated version of week 43 and an addition of week 44.
Week 40 – among the lowest mortality on record for all age groups affected by Covid19.
Week 40 – among the lowest mortality on record for all age groups affected by Covid19.
13/17 Week 41 – second week with among the lowest mortality on record for all age groups affected by covid19.
14/17 Week 42 – third week with among the lowest mortality on record for all age groups affected by covid19.
15/17 Week 43 – fourth week with among the lowest mortality on record for all age groups affected by covid19.
16/17 Cases began increasing around week 39, but case counts did accelerate quite a bit from week 44 and on. I think the tables in this thread will provide a reliable framework to observe whether we are moving into an unprecedented situation or something relatively “normal”.
17/17 The coming 2-3 weeks will be crucial. Let’s hope that the seasonal increase in mortality continues to come in below baseline. If so, we must rethink how we present mortality statistics. Our behavior cannot rely on the name of the predominant respiratory virus of the season.
A sidenote: making predictions that mortality will increase right as we move into winter is like saying the sun will rise in the east. If this is you, please spare us from the self-congratulatory “I was right”-tweets. They are of benefit to no one but yourself.

 Read on Twitter