Similarities between 2014 & 2020 setups.
#PSUBANKS
#CANBK
#BankBaroda
#SBIN
#INDIANBANK
#UnionBankofIndia
All these stocks post a big fall went into consolidation phase for good 7-8-9 months before giving strong breakout. Some stocks gave 60-70% return in short term
#PSUBANKS
#CANBK
#BankBaroda
#SBIN
#INDIANBANK
#UnionBankofIndia
All these stocks post a big fall went into consolidation phase for good 7-8-9 months before giving strong breakout. Some stocks gave 60-70% return in short term
#CANBK - 2013-2014
1. Stock made intermeidate top around 292-295 from 190 levels which was august 2013 lows
2. Higher bottom was done aroun 207+ levels in Feb 2014 and then gave breakout in May 2014
3. Stock spent 9+ months in 190-295 range before breaking out.
1. Stock made intermeidate top around 292-295 from 190 levels which was august 2013 lows
2. Higher bottom was done aroun 207+ levels in Feb 2014 and then gave breakout in May 2014
3. Stock spent 9+ months in 190-295 range before breaking out.
#CANBK - 2020
4. Stock hit a low in March 2020 (75 Levels)
5. Intermediate tops around 118-120 levels
6. Higher bottom is made around Sep 2020 (82 Low) consolidation is around 8 months.
7. Range so far 80-118, once taken out we can expect 150-160 targets atleast.
4. Stock hit a low in March 2020 (75 Levels)
5. Intermediate tops around 118-120 levels
6. Higher bottom is made around Sep 2020 (82 Low) consolidation is around 8 months.
7. Range so far 80-118, once taken out we can expect 150-160 targets atleast.
#BankBaroda - 2013-2014
1. Low 85 in August 2013, intermediate top 142 in December 2013, Breakout in March-April 2014
2. formation of higher bottom around 100+ levels in Feb 2014
3. Consolidation time 7 months, Range 85-145, stock did 230 levels in 1.5-2months
1. Low 85 in August 2013, intermediate top 142 in December 2013, Breakout in March-April 2014
2. formation of higher bottom around 100+ levels in Feb 2014
3. Consolidation time 7 months, Range 85-145, stock did 230 levels in 1.5-2months
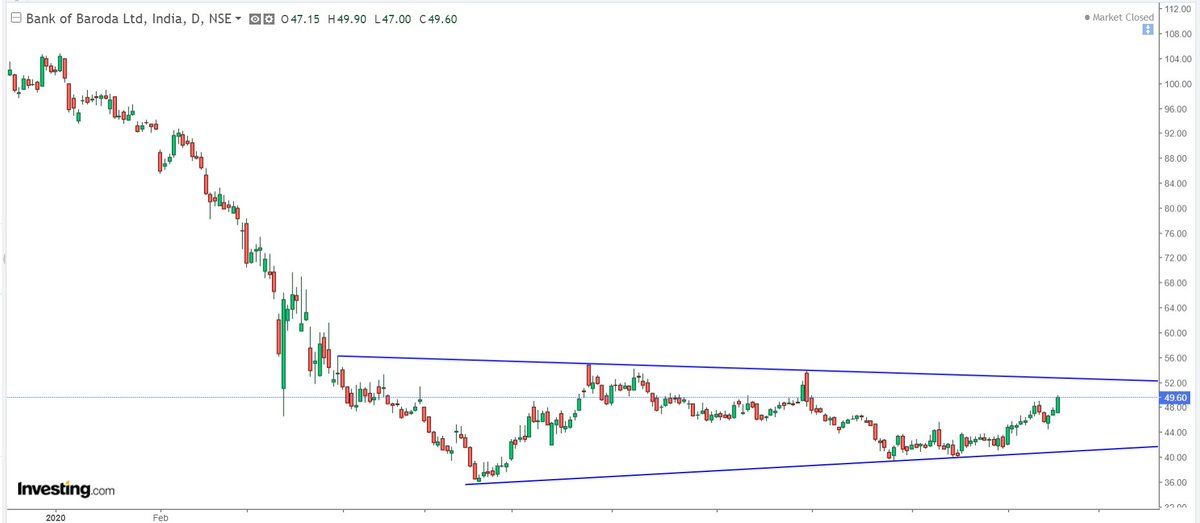
#BankBaroda - 2020
4. Low 36 in May 2020, intermeidate tops 53-55 in June-August 2020
5. Range 36-55, consolidation so far 7 months, above 55 can do 75-80 levels which is 40-50% return
6. Setup has similar pattern and consolidation time unlike 2014
4. Low 36 in May 2020, intermeidate tops 53-55 in June-August 2020
5. Range 36-55, consolidation so far 7 months, above 55 can do 75-80 levels which is 40-50% return
6. Setup has similar pattern and consolidation time unlike 2014
#SBIN 2013-2014
1. Stocks hits low 145 in August 2013, intermediate tops around 192-195 levels in November-December 2013.
2. Higher/similar bottom 145 in Feb 2014, Breakout in April 2014.
3. Range 145-195, stock went on to hit 285 and 335
4. consolidation time 7-8 months
1. Stocks hits low 145 in August 2013, intermediate tops around 192-195 levels in November-December 2013.
2. Higher/similar bottom 145 in Feb 2014, Breakout in April 2014.
3. Range 145-195, stock went on to hit 285 and 335
4. consolidation time 7-8 months
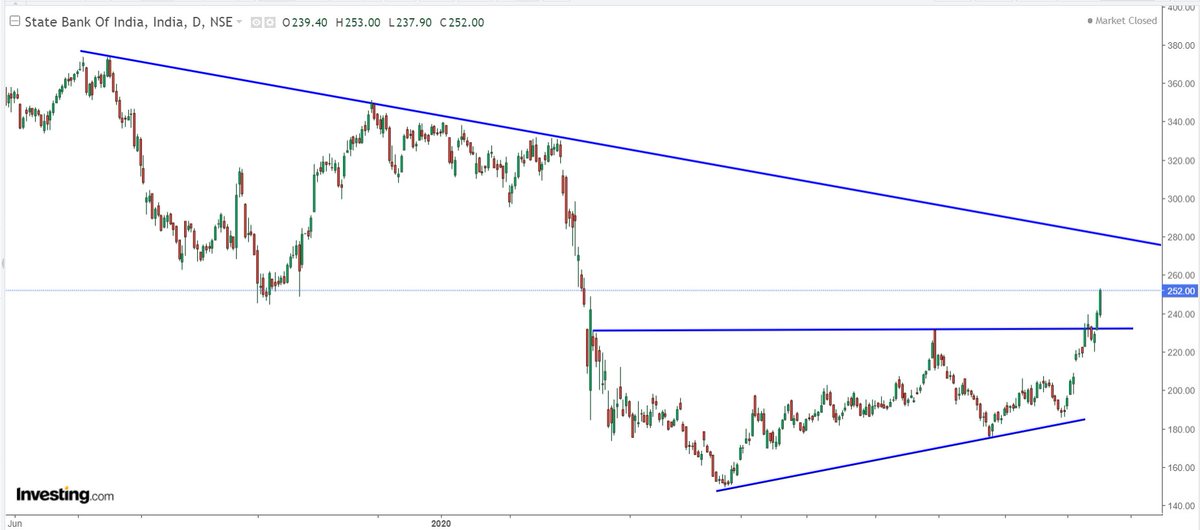
#SBIN 2020
5. Low 150 in May 2020, intermediate top 231+ in August 2020, higher bottom 175 in Septemebr 2020.
6. Breakout in November 2020 above 231+, range 150-175 to 230
7. Target 275-280 due to falling trendline, for short term 255 resistance
8. consolidation time 7 months
5. Low 150 in May 2020, intermediate top 231+ in August 2020, higher bottom 175 in Septemebr 2020.
6. Breakout in November 2020 above 231+, range 150-175 to 230
7. Target 275-280 due to falling trendline, for short term 255 resistance
8. consolidation time 7 months
#IndianBank - 2013-2014
1. Low 60+ in august 2013, intermediate top 120+ in January 2014, higher bottom 85+ in Feb 2014, Breakout in april 2014
2. Range 60-120, consolidation time 7-8 months
3. stock did 200 levels in a matter of 2 months
1. Low 60+ in august 2013, intermediate top 120+ in January 2014, higher bottom 85+ in Feb 2014, Breakout in april 2014
2. Range 60-120, consolidation time 7-8 months
3. stock did 200 levels in a matter of 2 months
#IndianBank - 2020
4. Low 41+ in March 2020, Intermediate tops 71-73 in June-August 2020
5. Higher bottoms 43-53 in May-Sep 2020
6. Range 42-73, target 90-95
7. consolidation time 8 months so far
4. Low 41+ in March 2020, Intermediate tops 71-73 in June-August 2020
5. Higher bottoms 43-53 in May-Sep 2020
6. Range 42-73, target 90-95
7. consolidation time 8 months so far
#Unionbankofindia 2013-2014
1. Low 97 in August 2013, intermediate tops 142-140 in September-November 2013, Breakout in april 2014
2. consolidation time 7-8 months, range 97-142, stock did 255-260 in 2 months
1. Low 97 in August 2013, intermediate tops 142-140 in September-November 2013, Breakout in april 2014
2. consolidation time 7-8 months, range 97-142, stock did 255-260 in 2 months
#Unionbankofindia 2020
3. Low 22+ in May 2020, Intermeidate top 35-33 in June-August 2020
4. Higher bottom 25 in September 2020
5. Range 22-35, consolidation time so far 6-7 months. Target can be 48-50
3. Low 22+ in May 2020, Intermeidate top 35-33 in June-August 2020
4. Higher bottom 25 in September 2020
5. Range 22-35, consolidation time so far 6-7 months. Target can be 48-50
Bank of India has similar setup.
Most of these stocks consolidated for good 7-8 months which is a good sign of bottoming process.
Once the range is broken these stocks can give quick moves in short time. Only difference is we dont have LS polls now.
Most of these stocks consolidated for good 7-8 months which is a good sign of bottoming process.
Once the range is broken these stocks can give quick moves in short time. Only difference is we dont have LS polls now.
There are 3 phases in Market
1. Accumulation
2. Public Participation
3. Distribution
I see this as accumulation stage for much bigger and stronger bull market as it is most hated sector.
Please do your own research. This is my personal view and u can term it as biased.
1. Accumulation
2. Public Participation
3. Distribution
I see this as accumulation stage for much bigger and stronger bull market as it is most hated sector.
Please do your own research. This is my personal view and u can term it as biased.
#PNB 2013-2014
#PNB 2020
1. Low 26 in May 2020, intermediate tops 38 in Jume-august 2020
2. Higher bottom 26 in october 2020, range 22-26 to 38, consolidation time 7-8 months
3. Target 50-54 post breakout above 38
1. Low 26 in May 2020, intermediate tops 38 in Jume-august 2020
2. Higher bottom 26 in october 2020, range 22-26 to 38, consolidation time 7-8 months
3. Target 50-54 post breakout above 38
Unfortunately I am not a fundamental analyst, but i go with best 3 SBIN, CANBK and Bank Baroda.
SBI is already moved to 252 above 232, for trading point of view will avoid and do not wish to chase it right now.
Indian bank, PNB are my last options based on chart setups
SBI is already moved to 252 above 232, for trading point of view will avoid and do not wish to chase it right now.
Indian bank, PNB are my last options based on chart setups
Adding PSU Bank index chart tomorrow.
Technically 1240-1600 range is about to break.
Can do 1890-1900 which is also retest of breakdown of major lows.
Technically 1240-1600 range is about to break.
Can do 1890-1900 which is also retest of breakdown of major lows.
#BankIndia
1. Has potential to test 58-60 levels
2. Short term resistance at 45.
3. Long term targets 70-75
4. consolidation is about 8 months
1. Has potential to test 58-60 levels
2. Short term resistance at 45.
3. Long term targets 70-75
4. consolidation is about 8 months
#NIFTYPSUBANK - 2020
1. Index is out of July 2019 falling pink trendline suggesting trend change
2. Range 1250-1600, false breakout abv 1600 on 31.08.2020
3. 1078 Low in May 2020, 1248 higher bottom in october 2020
4. As per dow theory bottom is confirmed abv 1600 tgt 1900
1. Index is out of July 2019 falling pink trendline suggesting trend change
2. Range 1250-1600, false breakout abv 1600 on 31.08.2020
3. 1078 Low in May 2020, 1248 higher bottom in october 2020
4. As per dow theory bottom is confirmed abv 1600 tgt 1900
#NIFTYPSUBANK - 2013-2014
5. Low 1900 in August 2013, Intermediate tops 2680-90 in November- December 2013
6. Higher bottom 2070 in February 2014, breakout in april 2014, range 2700-2000, breakout in April 2014, index did 4000 in 2 months
7. consolidation again 7-8 months.
5. Low 1900 in August 2013, Intermediate tops 2680-90 in November- December 2013
6. Higher bottom 2070 in February 2014, breakout in april 2014, range 2700-2000, breakout in April 2014, index did 4000 in 2 months
7. consolidation again 7-8 months.
8. Psu Bank index given fresh breakout from short term range 1440-1505.
Index is heading towards 1900 where it have major breakdown
Index is heading towards 1900 where it have major breakdown
9. PSU Bank Index gave highest closing after 13th March 2020.
Price action suggesting something very positive in next few days.
We can see some mad moves. Watch out
Disclosure: Personally holding few stocks for trading, accumulated last week when posted this analysis.
Price action suggesting something very positive in next few days.
We can see some mad moves. Watch out
Disclosure: Personally holding few stocks for trading, accumulated last week when posted this analysis.

 Read on Twitter


