Arizona Vote Database analysis - THREAD
1/n
Arizona, the lynchpin of 2020 Election night, was both the easiest and the weirdest state to evaluate based off the data in the New York Times Decision Desk database.
CLICK THE IMAGE BELOW. Spreadsheet will be in 2/n
1/n
1/n
Arizona, the lynchpin of 2020 Election night, was both the easiest and the weirdest state to evaluate based off the data in the New York Times Decision Desk database.
CLICK THE IMAGE BELOW. Spreadsheet will be in 2/n
1/n
2/n
Screen shot 1
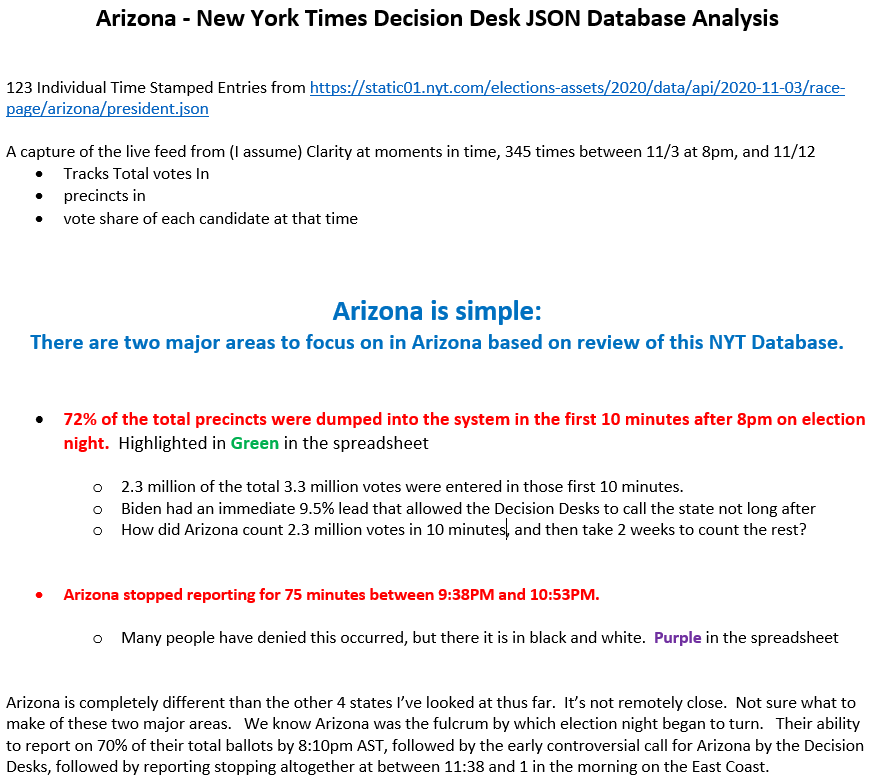
* ~70% of AZ vote reported in 10 minutes
* @LarrySchweikart is this typical of Arizona?
* Purple is the 75 minute pause in counting
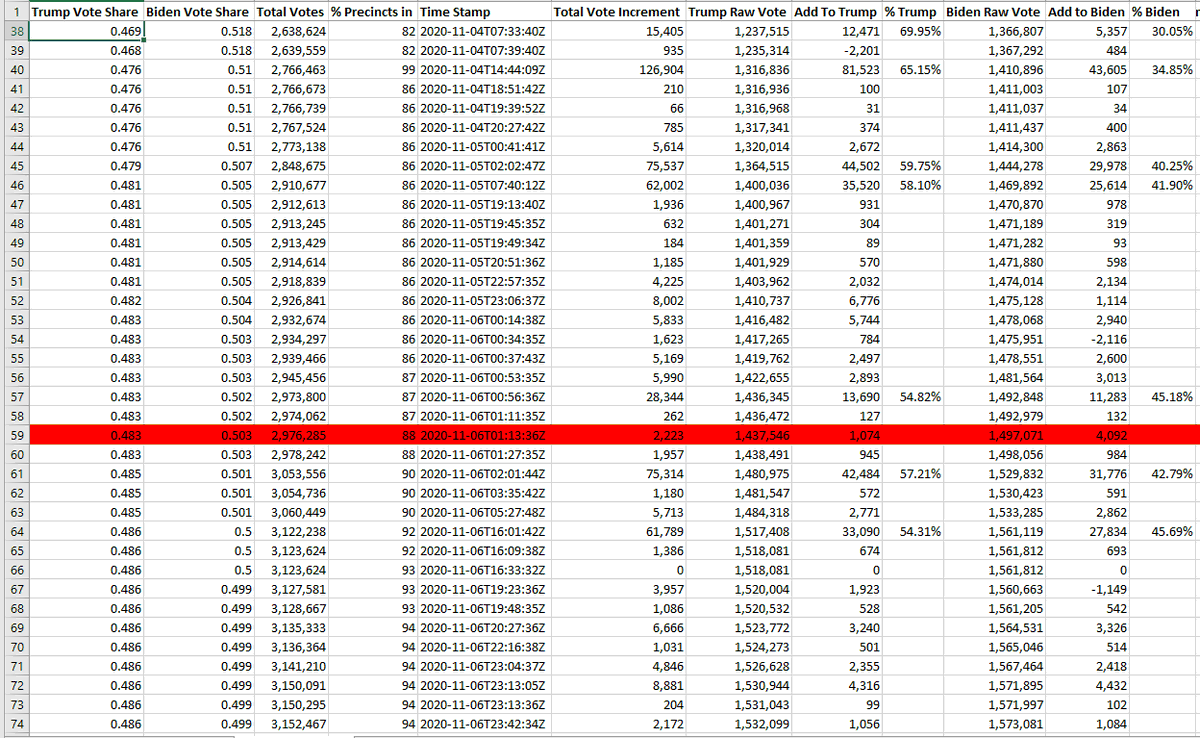
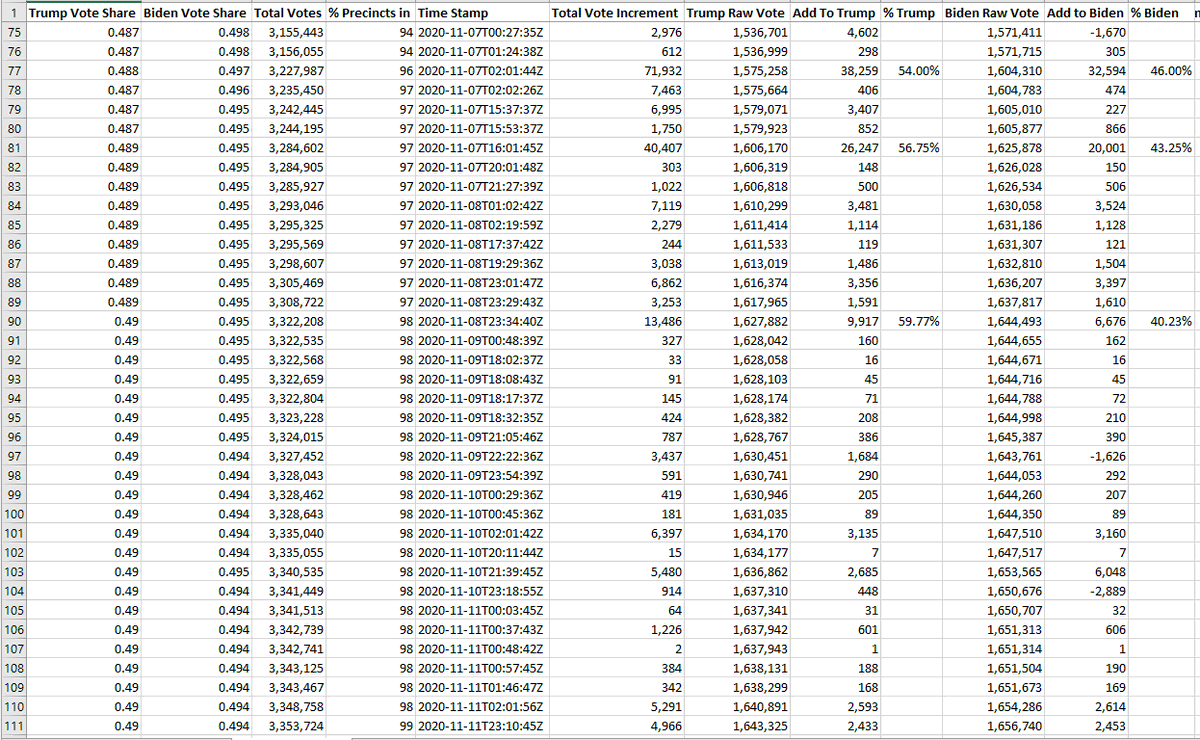
Screen shot #2 & 3 are Trump making up ground over the next days (and weeks). Only total 123 entries.
All of it very odd...
Screen shot 1
* ~70% of AZ vote reported in 10 minutes
* @LarrySchweikart is this typical of Arizona?
* Purple is the 75 minute pause in counting
Screen shot #2 & 3 are Trump making up ground over the next days (and weeks). Only total 123 entries.
All of it very odd...
Reading on Arizona, its not super clear but mail-in and absentee ballots are not allowed to be reported until 8pm on election night?
Arizona is odd. Getting 70% of the vote in 10 minutes doesn't shed a ton of light.
3/end
https://static01.nyt.com/elections-assets/2020/data/api/2020-11-03/race-page/arizona/president.json
Arizona is odd. Getting 70% of the vote in 10 minutes doesn't shed a ton of light.
3/end
https://static01.nyt.com/elections-assets/2020/data/api/2020-11-03/race-page/arizona/president.json

 Read on Twitter


