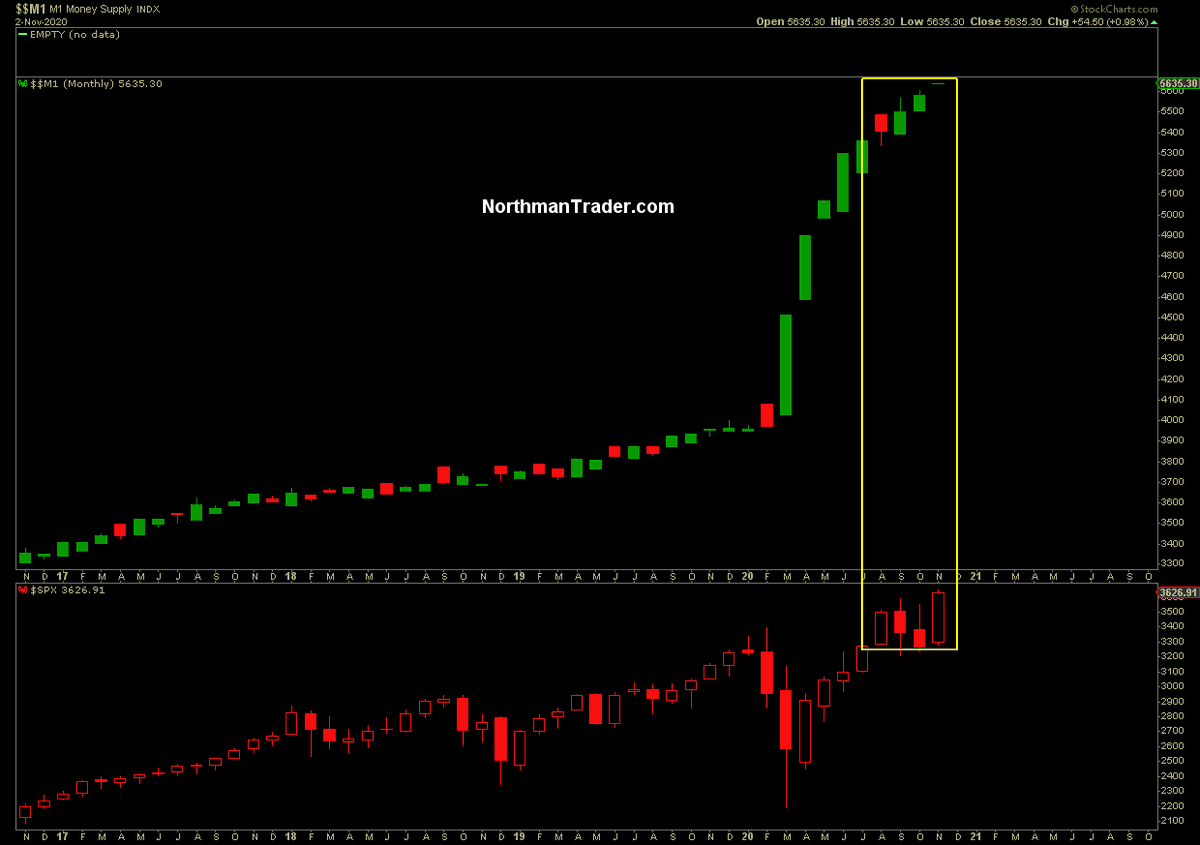
1 red candle in M1 money supply was enough for weakness in markets in September and October.
Since then, nothing but green candles and new highs in M1 money supply, markets soon followed.
The Fed can't stop printing or lose the market.
Since then, nothing but green candles and new highs in M1 money supply, markets soon followed.
The Fed can't stop printing or lose the market.
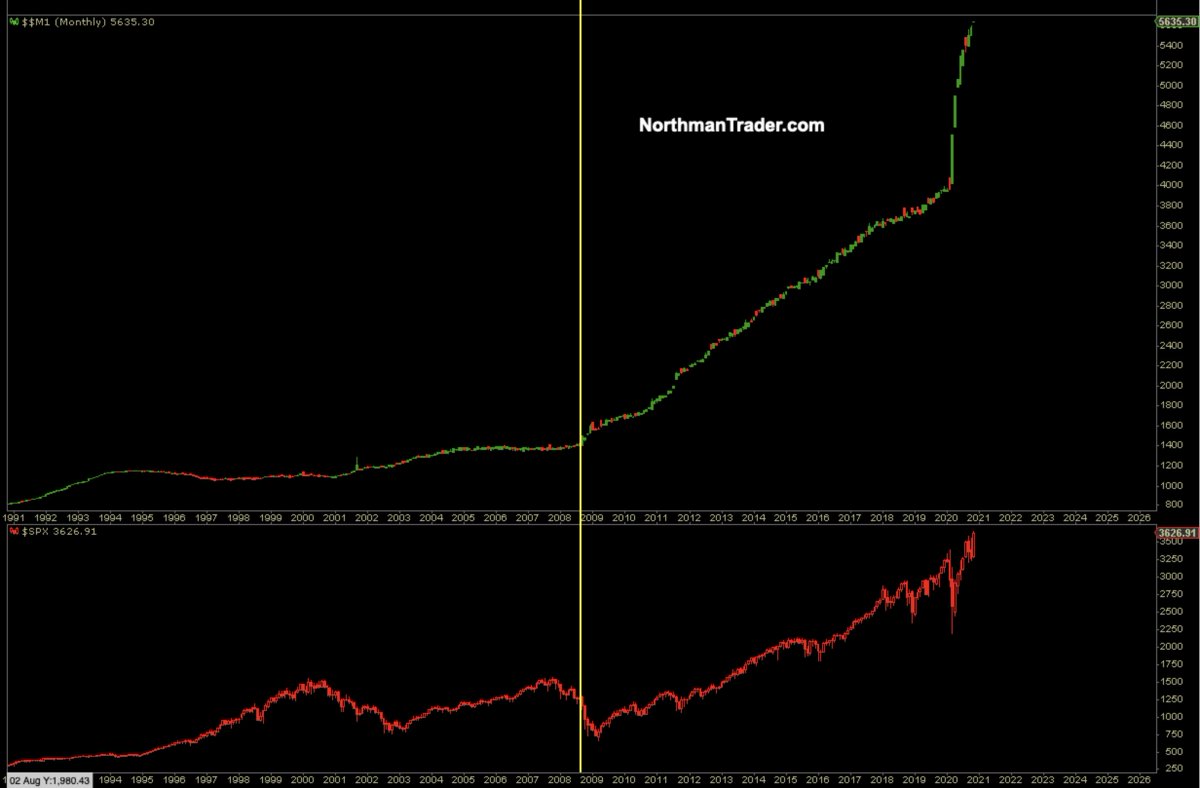
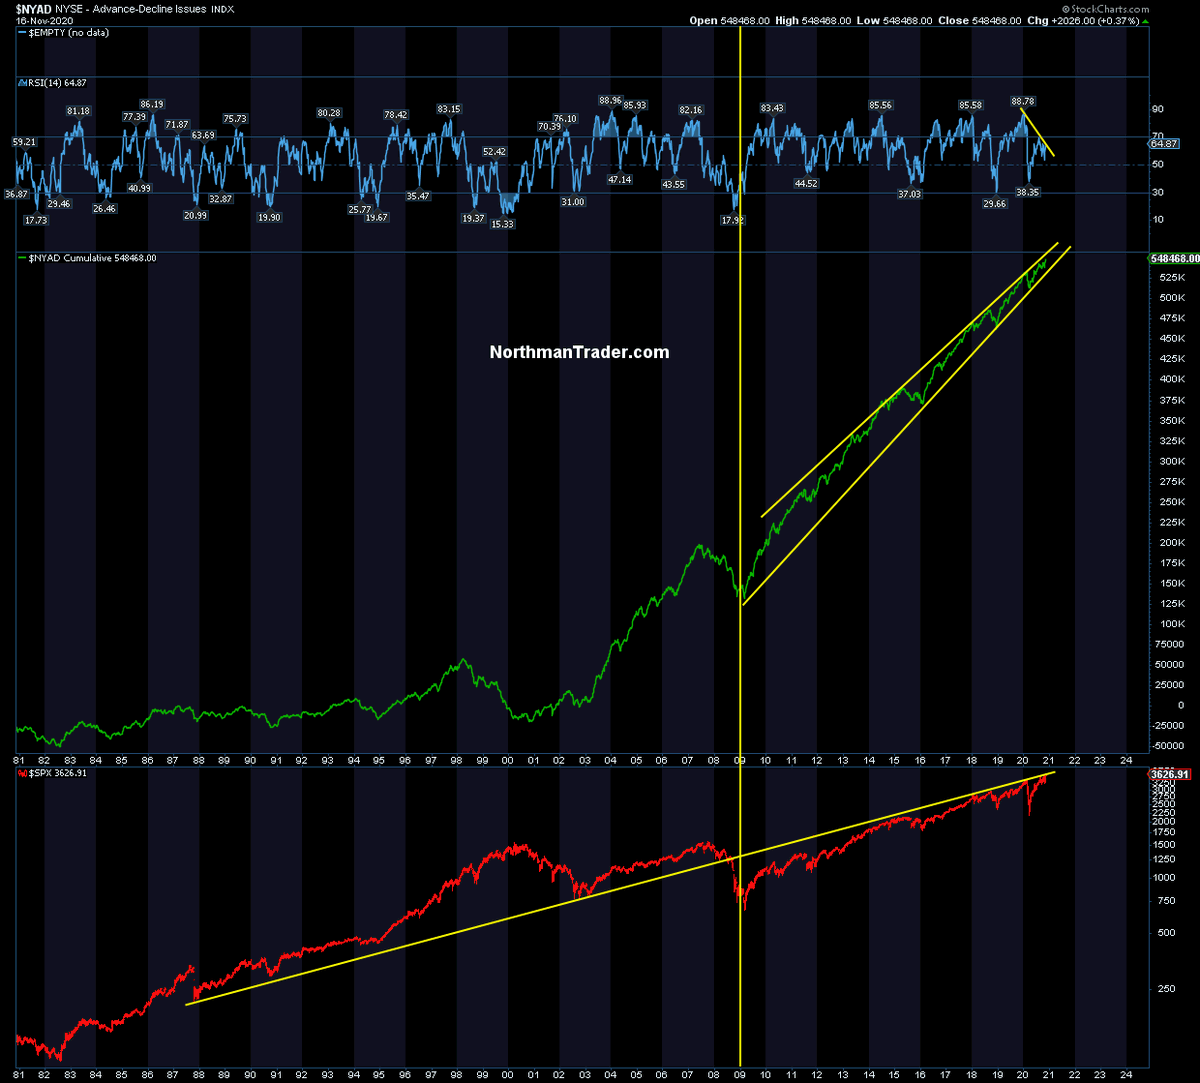
And just to give you the historical perspective:
The Fed has been managing these markets with printing ever since the GFC and they have never stopped, only paused here and there.
This year they went fully obscene.
It has distorted everything.
The Fed has been managing these markets with printing ever since the GFC and they have never stopped, only paused here and there.
This year they went fully obscene.
It has distorted everything.
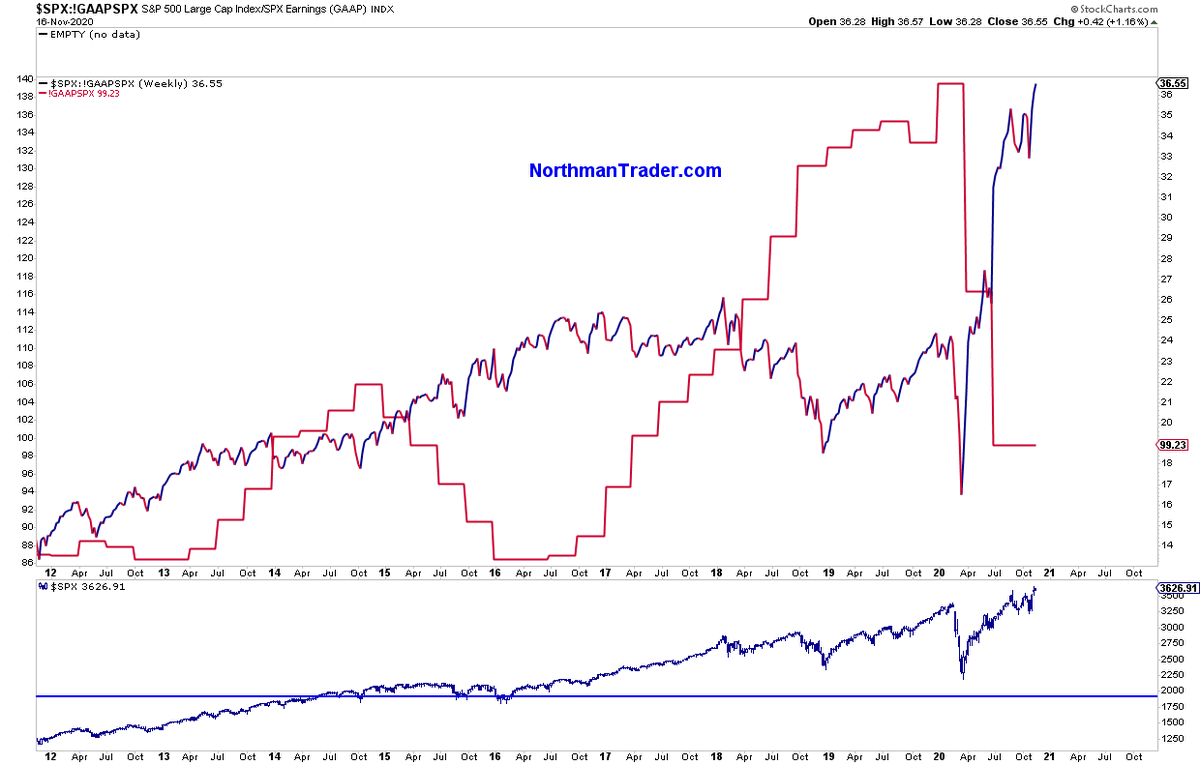
If markets were still related to actual earnings $SPX would trade much lower.
GAAP earnings hit levels seen during 2014/2015 when $SPX was trading at 1700-2000.
The decline was stopped dead in its track & pushed to new all time highs on pure multiple expansion.
GAAP earnings hit levels seen during 2014/2015 when $SPX was trading at 1700-2000.
The decline was stopped dead in its track & pushed to new all time highs on pure multiple expansion.
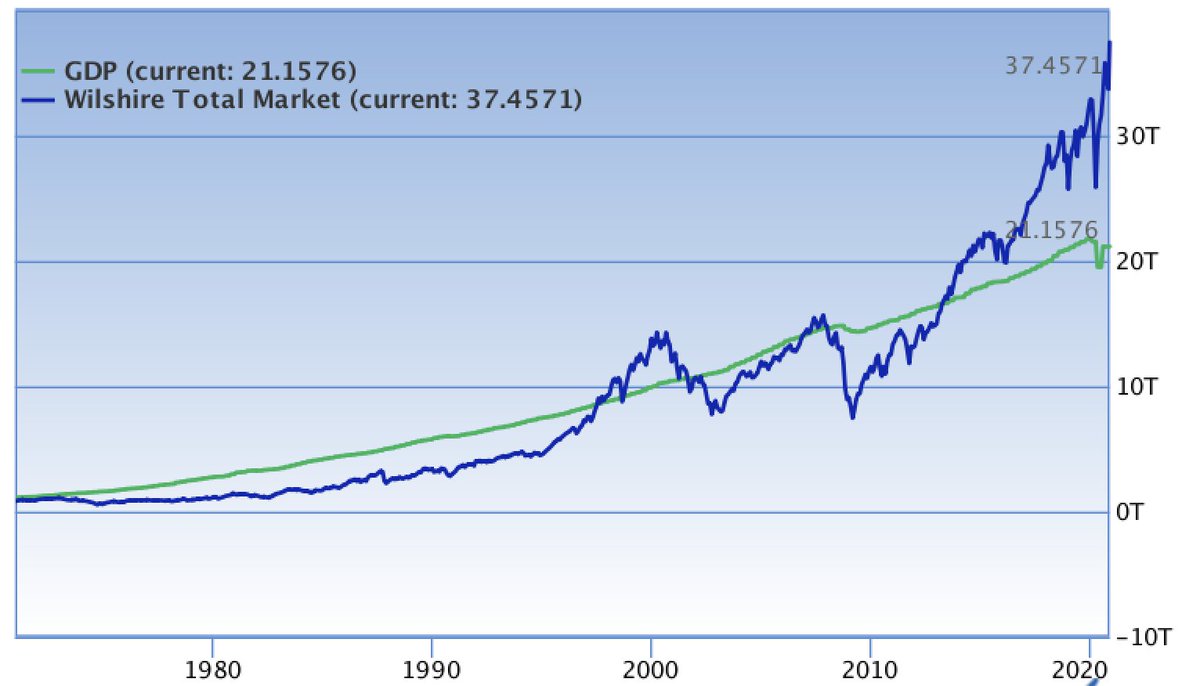
The result: The most disconnected market in history untethered from the economy and fundamentals.
A market now valued at $37.45 trillion or 177% market cap to GDP.
It is the biggest bubble of our life times entirely dependent on permanent intervention.
A market now valued at $37.45 trillion or 177% market cap to GDP.
It is the biggest bubble of our life times entirely dependent on permanent intervention.
Addendum: You will not find any of these charts and issues highlighted in the rosy market reports published by Wall Street banks, the same banks that keep telling people to buy into the highest valuations and largest economic disconnect in history.

 Read on Twitter