NEW: #Election2020  turnout is the highest in over a century, but who's gotten the most votes, and where? We looked at precinct & county data in key areas to find out: [THREAD]
By @jburnmurdoch & me — our second @FT collab in two weeks! https://www.ft.com/content/31a0273a-d745-4ed5-b497-c7c61c26e32d
 turnout is the highest in over a century, but who's gotten the most votes, and where? We looked at precinct & county data in key areas to find out: [THREAD]
By @jburnmurdoch & me — our second @FT collab in two weeks!
 https://www.ft.com/content/31a0273a-d745-4ed5-b497-c7c61c26e32d
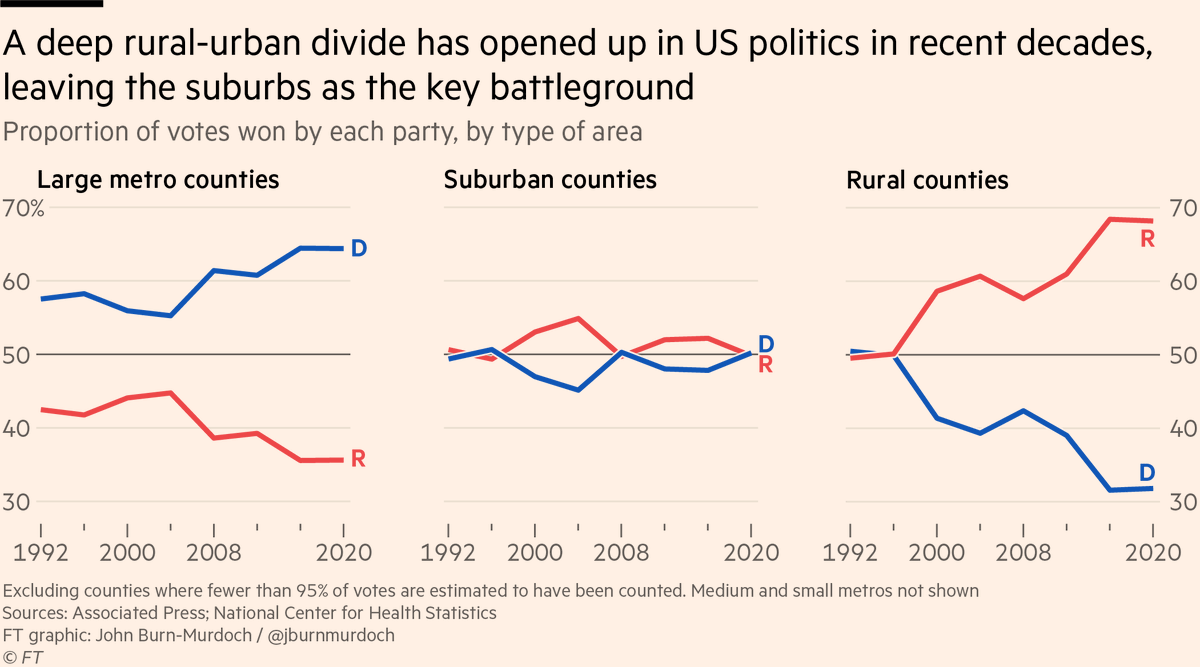
1/ Much of the story's in the suburbs, which Biden "won back" to a certain extent. Meanwhile, a red rural wave has countered the suburban swing.
Result: an increasingly polarized US.
Result: an increasingly polarized US.
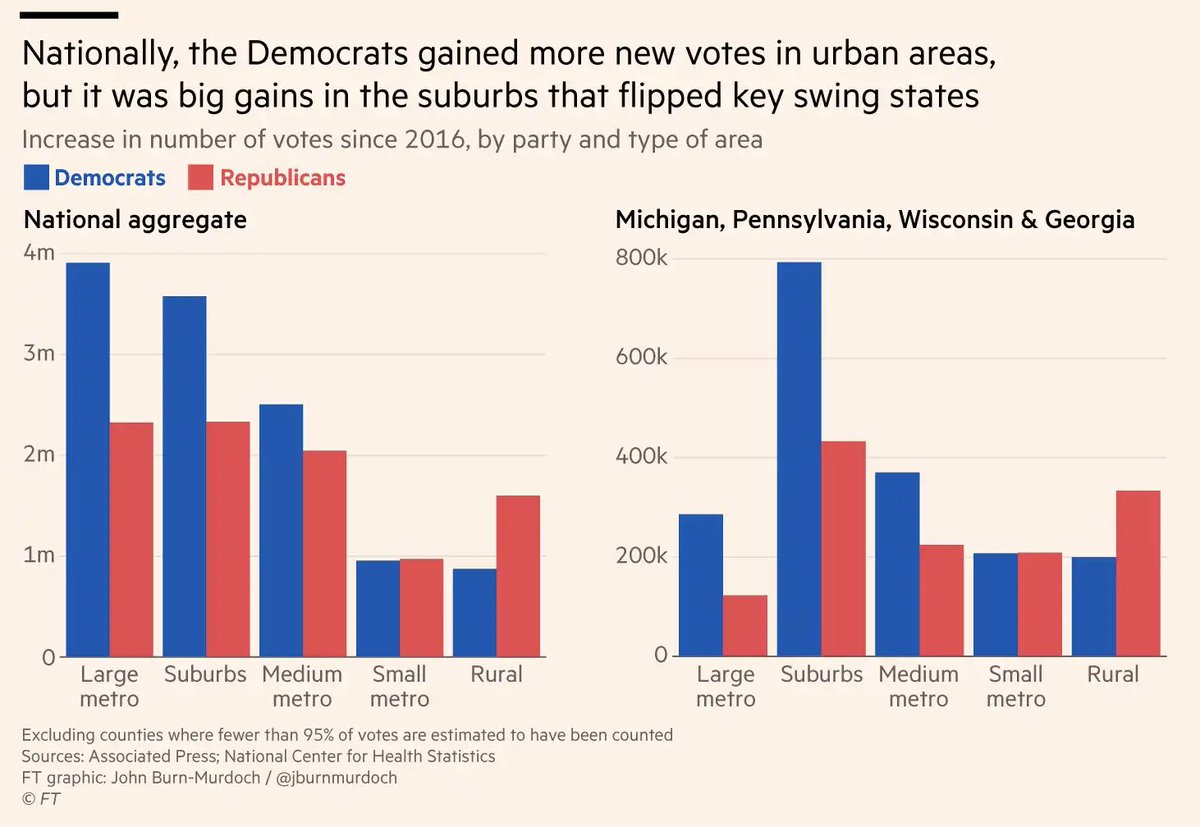
2/ More detail here: taking battlegrounds MI, PA, WI & GA as a whole, there's a clear & pronounced net vote increase in the suburbs for Biden in 2020 vs Clinton 2016
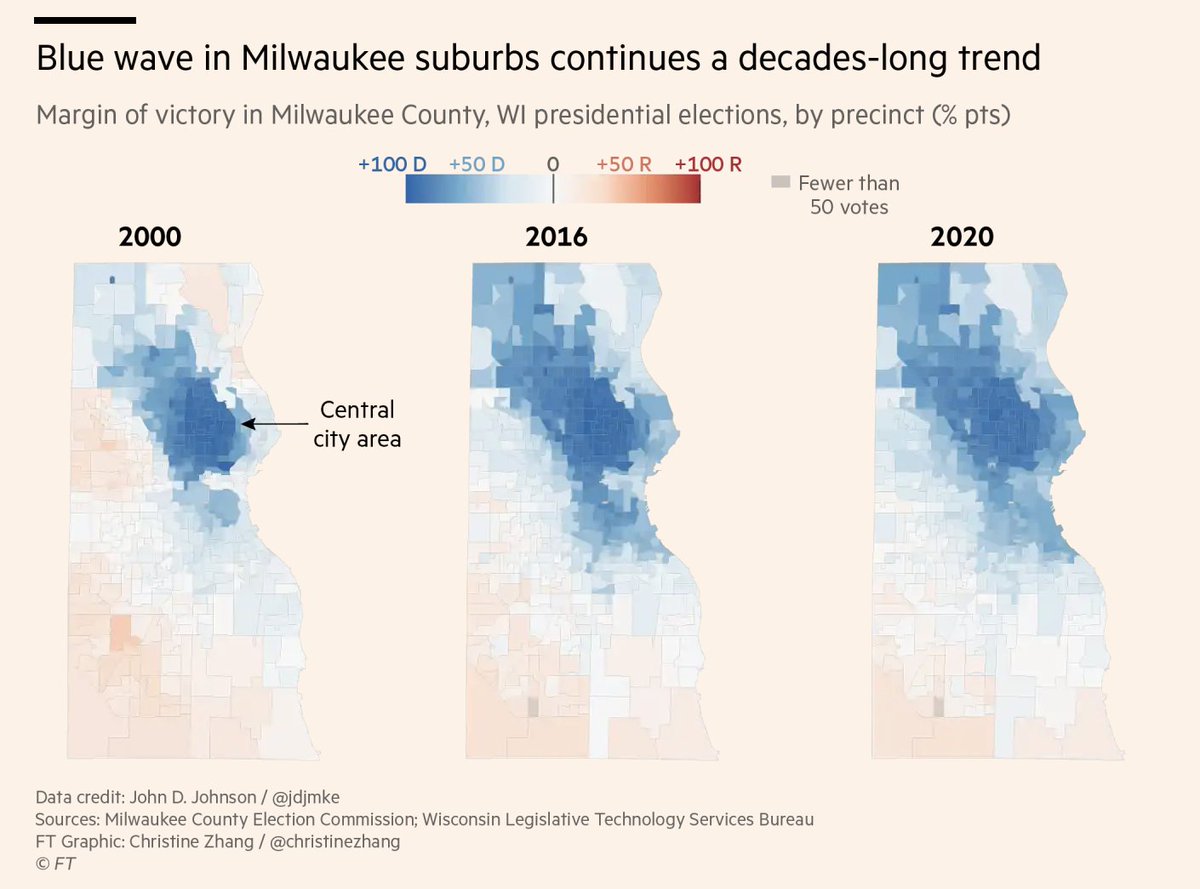
3/ Drilling down, let's look at Milwaukee: ~3.2m voters cast ballots in Wisconsin this year, a record high (raw & %terms). But in the state's biggest city, turnout stayed flat. It was the inner suburbs that delivered the "blue wave"
DATA CREDIT: @jdjmke https://johndjohnson.info/post/2020-milwaukee-county-analysis/
DATA CREDIT: @jdjmke https://johndjohnson.info/post/2020-milwaukee-county-analysis/
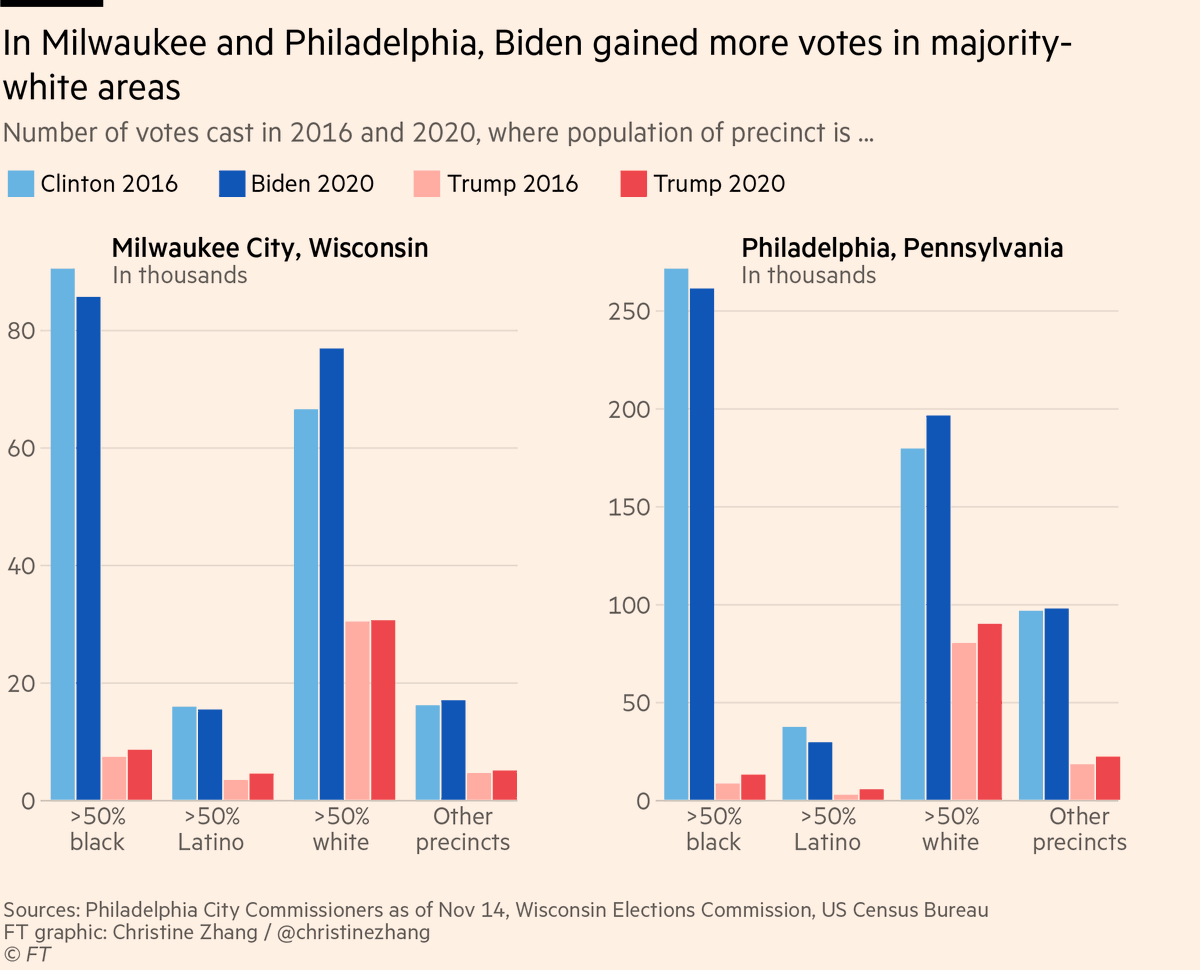
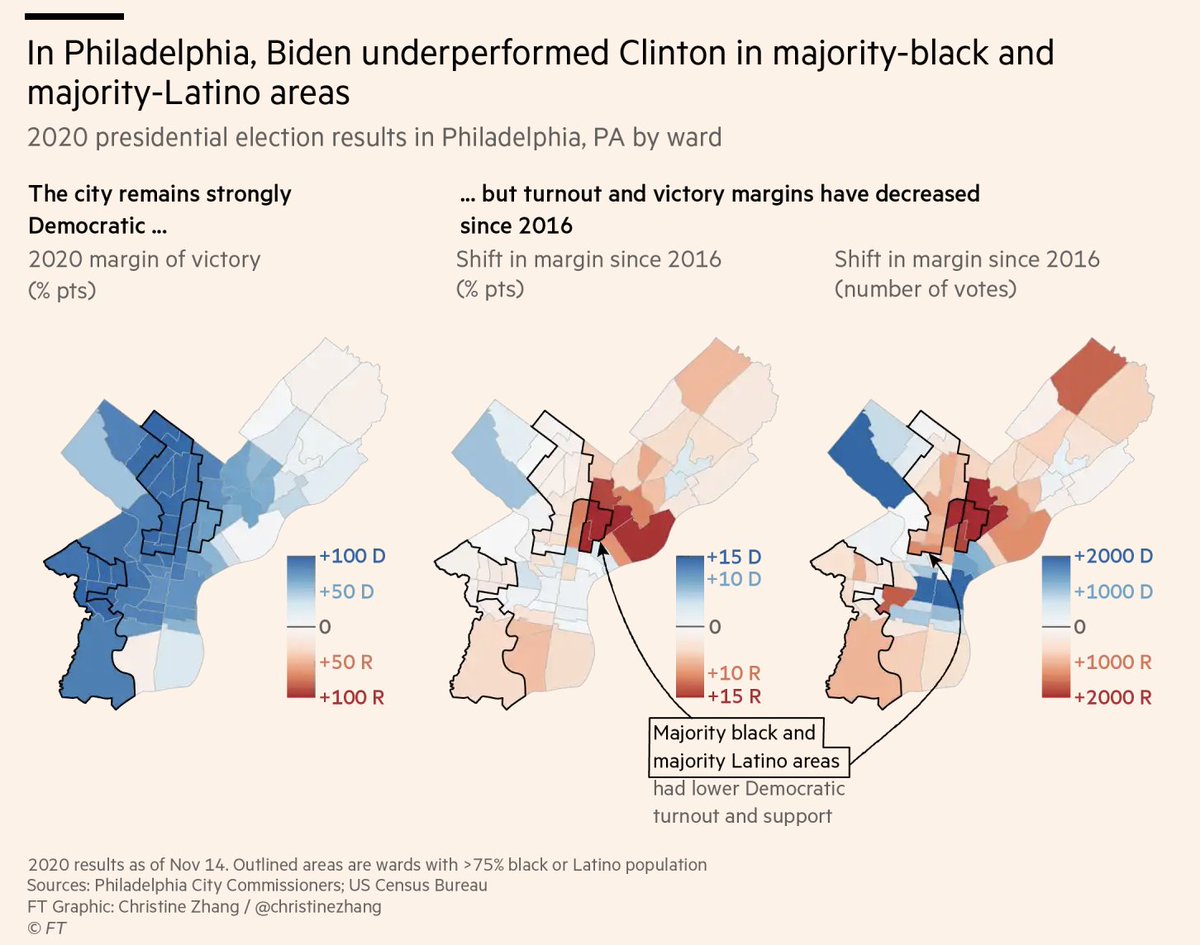
4/ It's a similar story in Philadelphia, which (as of writing) has cast 724,898 total prez ballots in 2020, only ~2% higher than the 709,681 cast in 2016.
In both Milwaukee City & Philly, Biden underperformed Clinton in majority-Black and majority-Latino areas:
In both Milwaukee City & Philly, Biden underperformed Clinton in majority-Black and majority-Latino areas:
5/ Keep in mind these cities are still overwhelmingly Democratic, and majority- non-white neighborhoods are still where Biden did the best. When we say "underperformed" we mean swing *relative* to 2016
6/ MAJOR HT to @sixtysixwards, btw, for his EXTREMELY USEFUL #rstats tutorial on how to reconcile changing city boundaries over time (more on that later when I discuss our methods section!) https://sixtysixwards.com/home/crosswalk-tutorial/
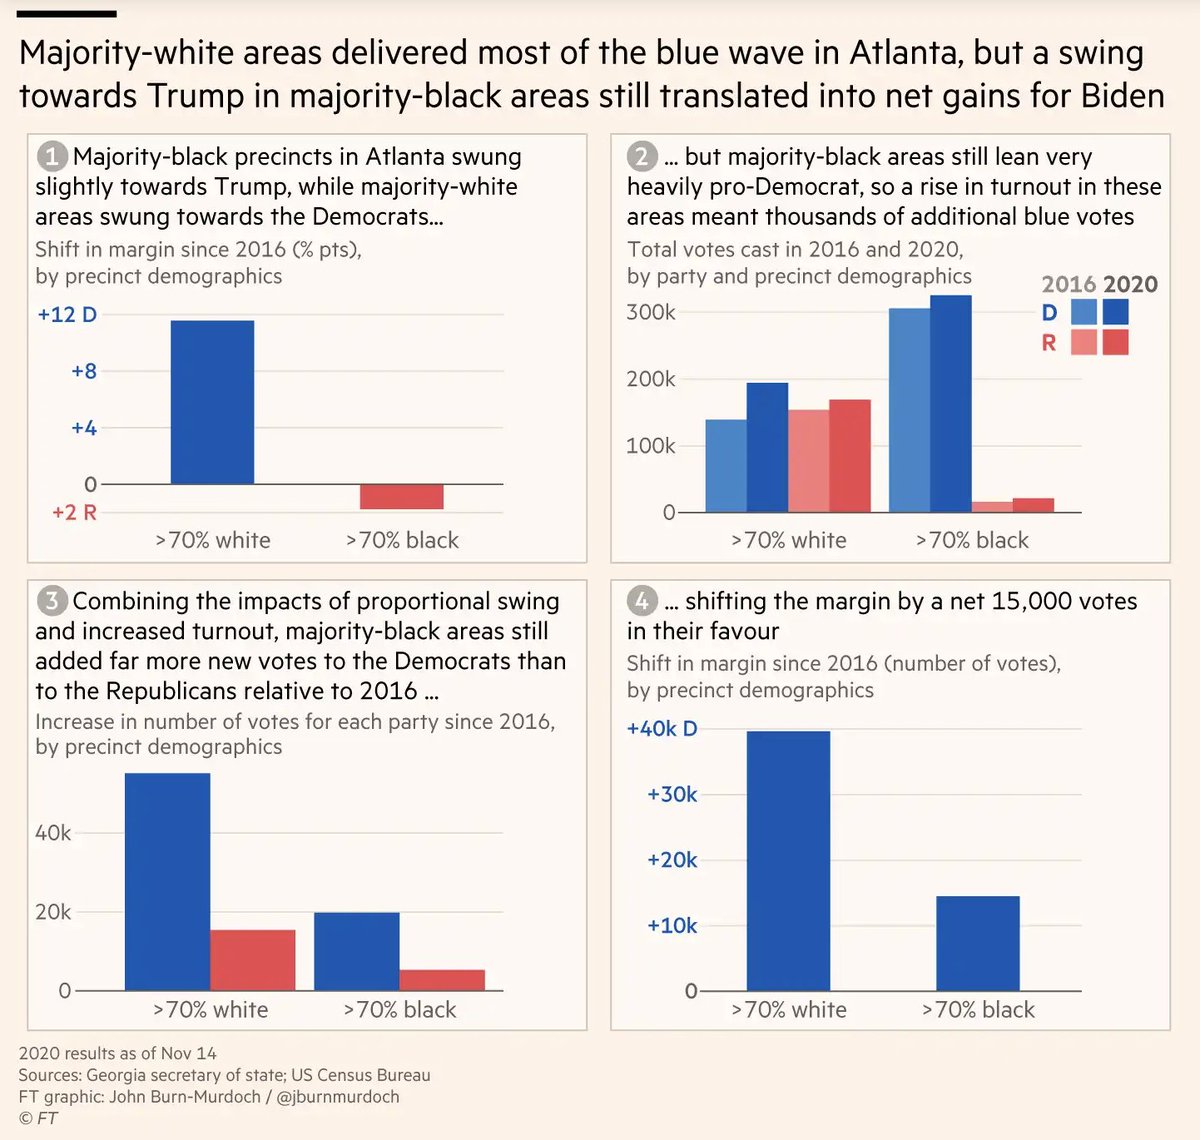
7/ In Atlanta, things are a bit different: number of ballots cast rose across the board. Majority-Black precincts swung *very* narrowly toward Trump in % terms, but still backed Biden 93 to 6
Result: majority-Black Atlanta precincts added ~15K more votes to Biden
Result: majority-Black Atlanta precincts added ~15K more votes to Biden
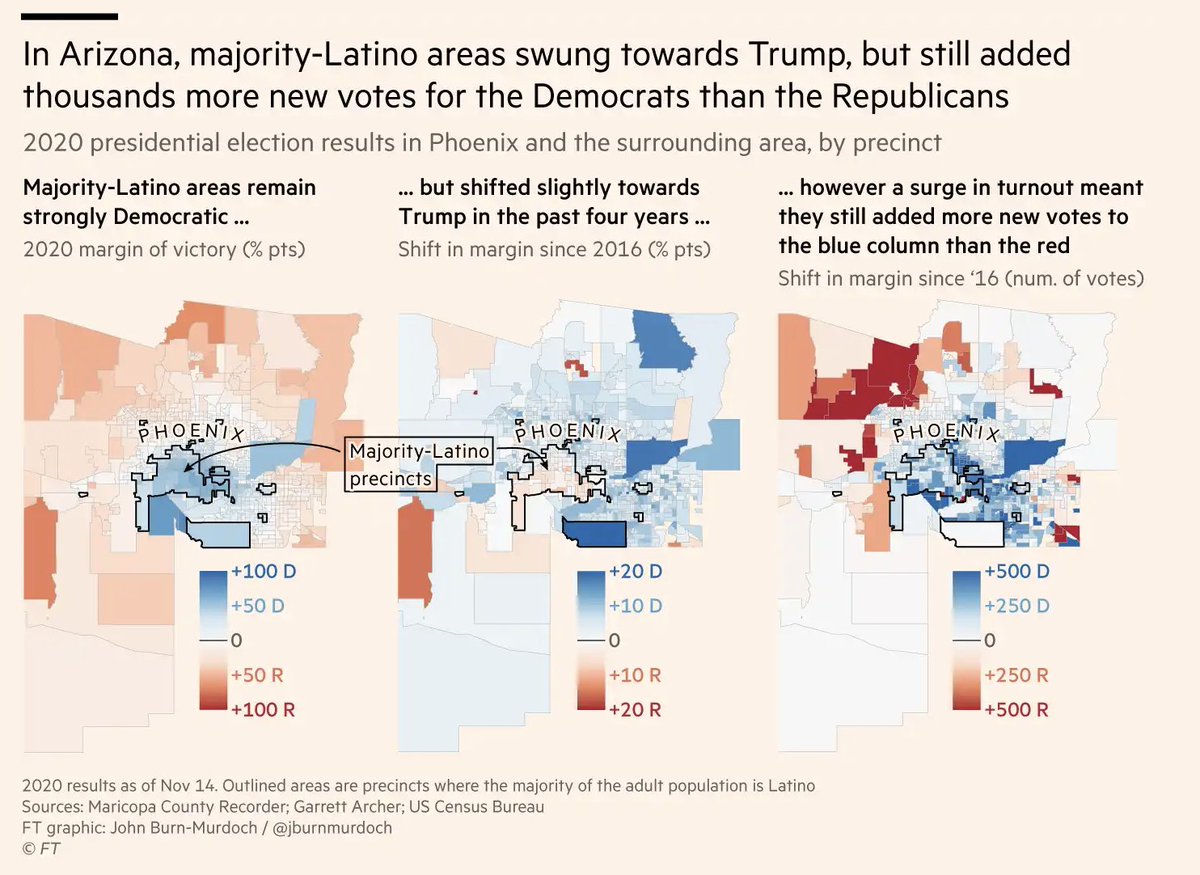
8/ Maricopa County, AZ is another example of how % swing is different than vote swing:
Phoenix swung *slightly* toward Trump, but it still added more votes to Ds than Rs
As with a lot of election narratives, **MORE THAN ONE THING CAN BE TRUE AT THE SAME TIME**
Phoenix swung *slightly* toward Trump, but it still added more votes to Ds than Rs
As with a lot of election narratives, **MORE THAN ONE THING CAN BE TRUE AT THE SAME TIME**
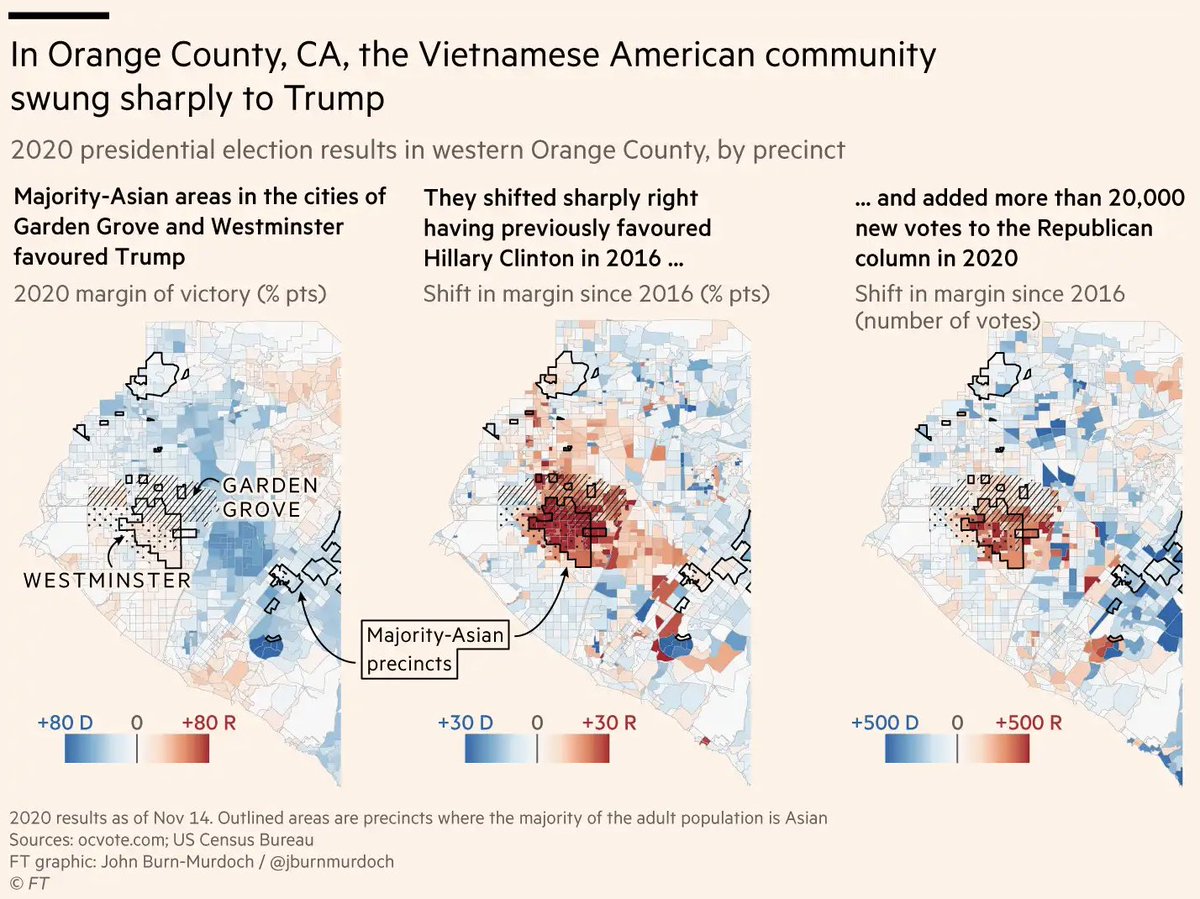
9/ Orange County, CA, where Republicans won back 2 House seats, is a story in its own right:
The county was Dem overall (54-44) for the second prez election since FDR ('16 was the 1st: https://www.latimes.com/projects/la-pol-ca-2016-orange-county-results/), but majority-Asian areas swung to Trump
https://www.ocregister.com/2020/11/13/how-did-your-neighborhood-vote-ballot-data-for-orange-county-reveals-curious-shifts-splits/
10/ To conclude:
> Suburban turnout+swung Dem, while rural areas swung more Republican
> Race has played a nuanced role: different groups in different places vote & turn out differently
> Non-white areas were key to the outcomes *for both parties* in different areas
> Suburban turnout+swung Dem, while rural areas swung more Republican
> Race has played a nuanced role: different groups in different places vote & turn out differently
> Non-white areas were key to the outcomes *for both parties* in different areas
11/ All right, if you've stayed with me this long, time for some ~~ NERDY PARTS ~~ and credits:
It's impt to recognize we're not going to have a public dataset of turnout estimates by race until the Census Bureau updates its Current Population Survey https://www.census.gov/topics/public-sector/voting.html
It's impt to recognize we're not going to have a public dataset of turnout estimates by race until the Census Bureau updates its Current Population Survey https://www.census.gov/topics/public-sector/voting.html
12/ This means that our analysis is a *rough* look at turnout & voting patterns in select places where we were able to obtain data. Just looking at votes in majority-minority vs majority-white areas is going to miss some key dynamics https://twitter.com/christinezhang/status/1326955237983334400
13/ For example, the closure of colleges & universities could have depressed turnout in Philly and other cities https://twitter.com/sixtysixwards/status/1325484375987924992
14/ Also, a D swing in majority-white suburbs is consistent w/our previous finding that Biden gained w/college-ed white voters. BUT the suburbs themselves are getting more diverse, also accounting for the shift
**2 things can be true at the same time** https://twitter.com/christinezhang/status/1325104495156736000
**2 things can be true at the same time** https://twitter.com/christinezhang/status/1325104495156736000
15/ In the same vein, in majority-non-white areas that swung slightly Rep, it could have been white voters *in those areas* that accounted for the swing. We don't have the data/analysis atm to really disentangle these effects
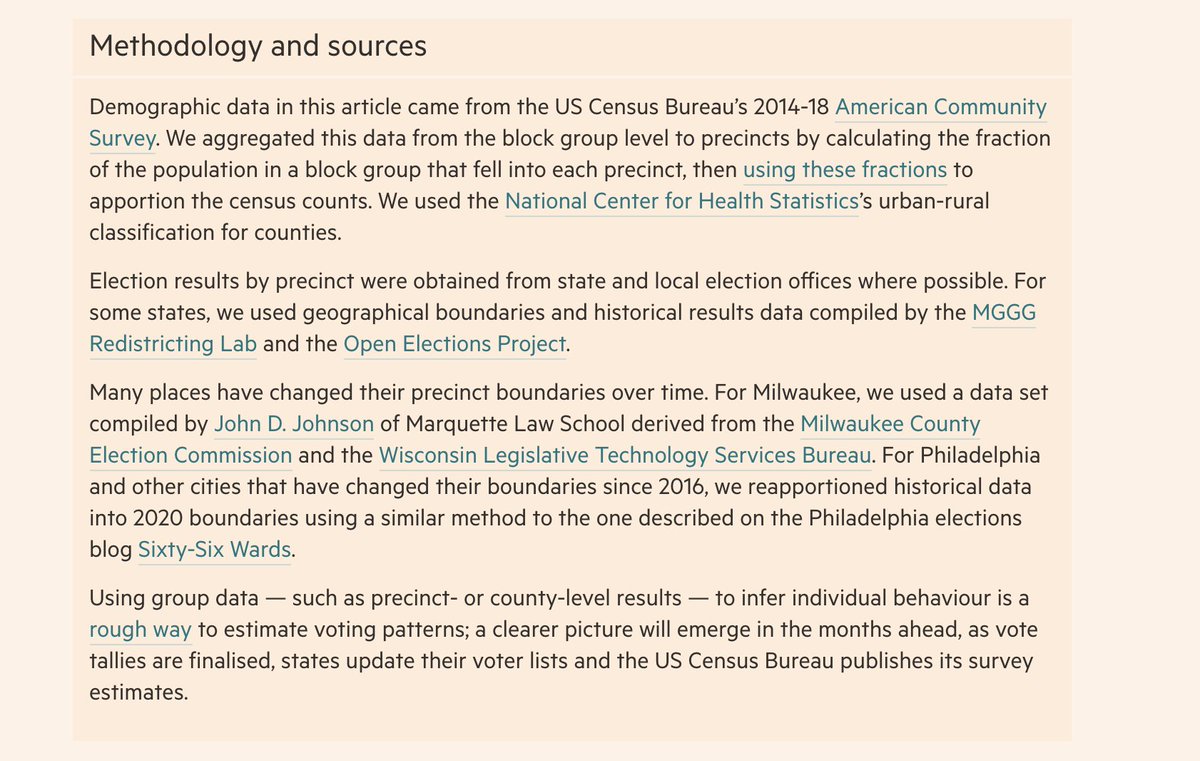
16/ Speaking of data, here are some of the elements of data wrangling that went into this:
a) finding 2020 and 2016 precinct results
b) merging 2020 with 2016
c) merging demographic data to 2020 precincts
a) finding 2020 and 2016 precinct results
b) merging 2020 with 2016
c) merging demographic data to 2020 precincts
17/ HT @gerrymandr & @openelex who have done *a lot* of work putting together historical precinct results and boundary files, which helped us with (a). (b) doesn't sound so hard until you realize that precinct boundaries have changed since 2016 
 ... https://twitter.com/christinezhang/status/1326570592821260293

 ... https://twitter.com/christinezhang/status/1326570592821260293
18/ Major props to the Wisconsin Legislative Technology Services Bureau who has disaggregated historical data into 2020 ward boundaries!!! Amazing!! HT @jdjmke for pointing this out, and for providing #rstats code to merge the data https://data-ltsb.opendata.arcgis.com/datasets/2012-2018-election-data-with-2020-wards
19/ But not all places do this, so we really appreciate @jtannen215 at Philadelphia elections blog @sixtysixwards providing a roadmap (in #rstats!) on how to do this, which we applied to other places as well: https://sixtysixwards.com/home/crosswalk-tutorial/
20/ The Appendix in this @sixtysixwards post is also instructive for how to achieve (c), b/c only in ur dreams do precinct boundaries line up with census tracts  https://sixtysixwards.com/home/the-turnout-funnel/
 https://sixtysixwards.com/home/the-turnout-funnel/
21/ A nerdy note on rural/urban: there's lots of ways to classify counties https://cityobservatory.org/what-is-urban ; we used https://www.cdc.gov/nchs/data_access/urban_rural.htm. That's why you'll see different numbers in different stories about "suburban" swing, though the story is largely the same https://www.brookings.edu/research/bidens-victory-came-from-the-suburbs/
22/ All this and more is in the STORY by @jburnmurdoch & me and edited by the amazing @AdrienneKlasa
Check it out for *even more* maps, charts & analysis


https://www.ft.com/content/31a0273a-d745-4ed5-b497-c7c61c26e32d
Check it out for *even more* maps, charts & analysis


https://www.ft.com/content/31a0273a-d745-4ed5-b497-c7c61c26e32d

 Read on Twitter