Thread: How to get visibility into Kubernetes networking with eBPF
or: How to run tcpdump in an entire k8s cluster?
tl;dr
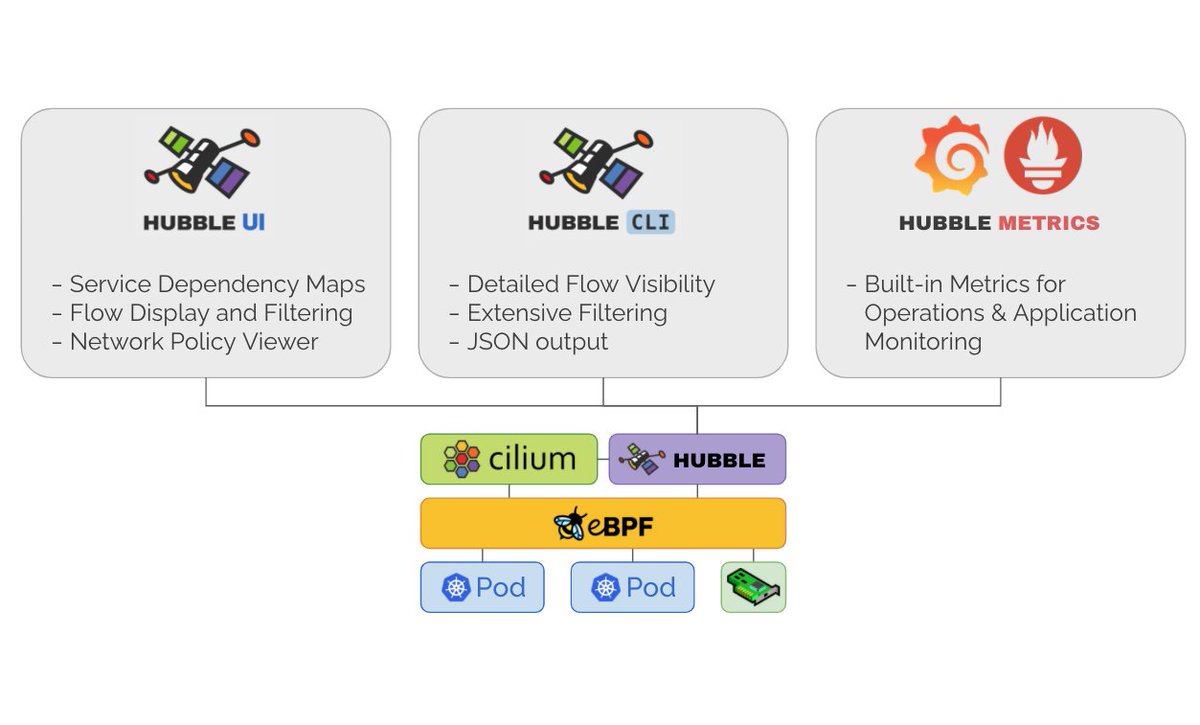
eBPF + Cilium + Hubble = Metrics, Flow Query API/CLI
or: How to run tcpdump in an entire k8s cluster?
tl;dr
eBPF + Cilium + Hubble = Metrics, Flow Query API/CLI
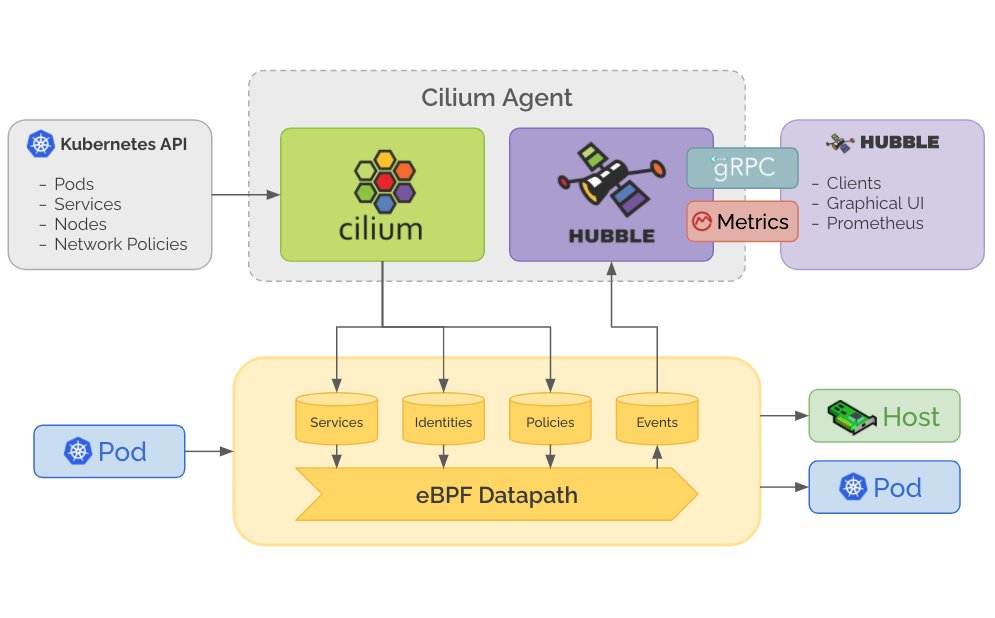
Network packets are processed by the eBPF datapath in the Linux kernel. Events and metrics are exported. Due to using eBPF performance profiling data structures, this is extremely low overhead.
Hubble picks up the signal, processes it, and provides per-node metrics and gRPC API
Hubble picks up the signal, processes it, and provides per-node metrics and gRPC API
Metrics (1/2)
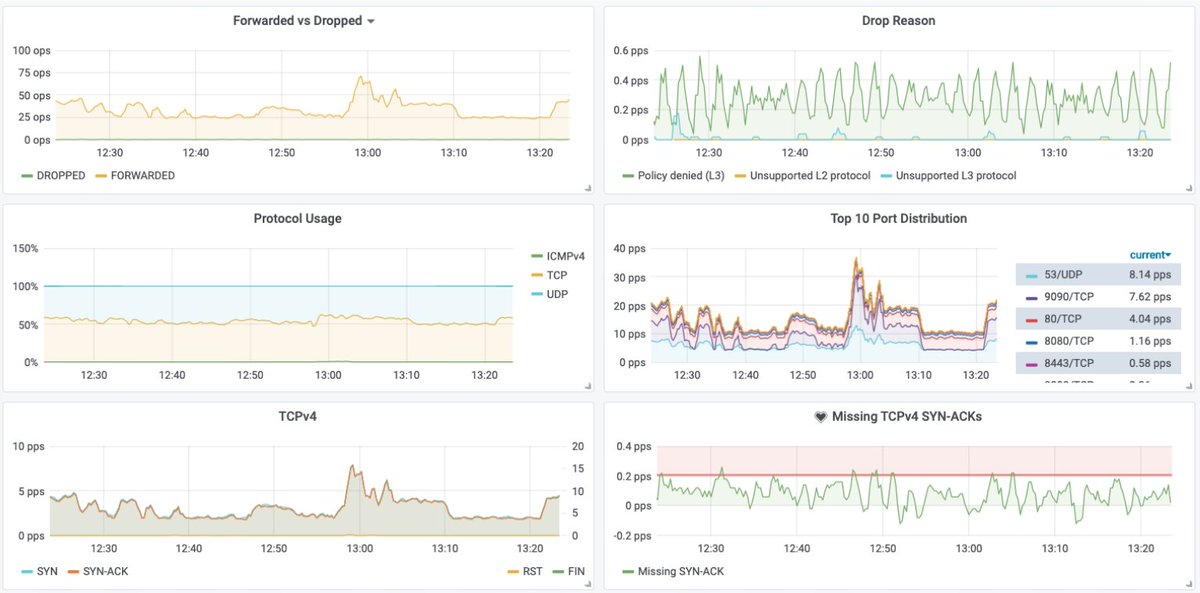
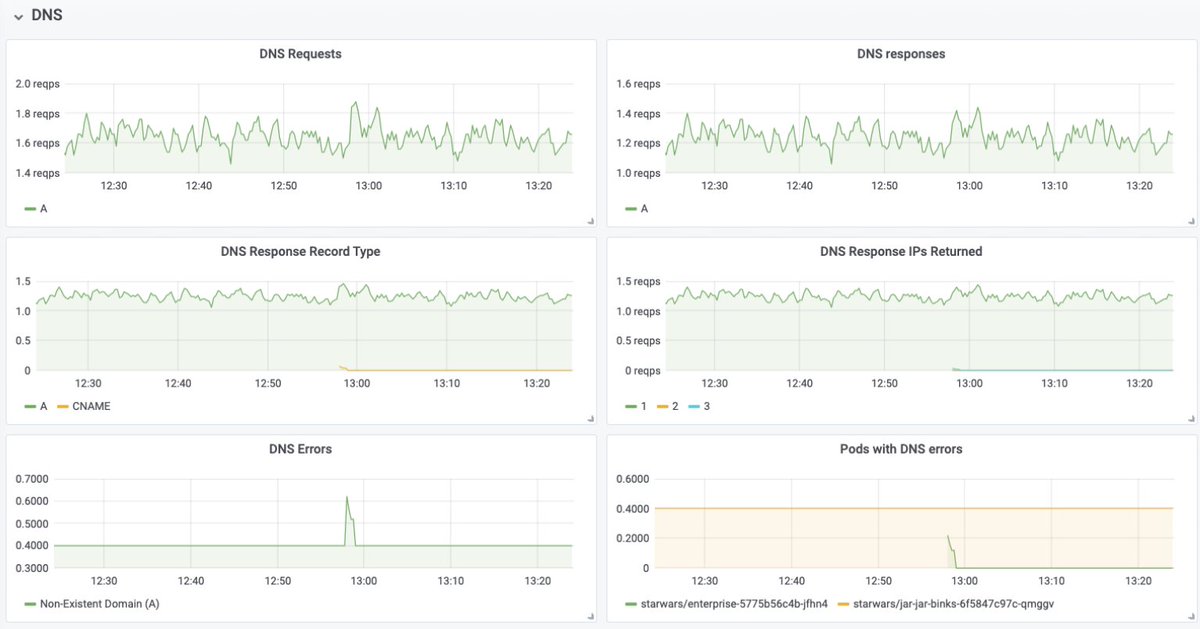
Each k8s node will expose Prometheus metrics that can be scraped and visualized with something like Grafana.
The metrics are programmable in Go so you can extend as you see fit: add new metrics, add labels, add filtering, ...
Installation:
https://docs.cilium.io/en/stable/operations/metrics/#hubble-metrics
Metrics (1/2)
The metrics available out of the box include: networking, TCP protocol, port distribution, DNS queries & error conditions, HTTP usage and latencies, NetworkPolicy decisions and violations, Service usage, ...
The metrics available out of the box include: networking, TCP protocol, port distribution, DNS queries & error conditions, HTTP usage and latencies, NetworkPolicy decisions and violations, Service usage, ...
CLI / Flow Query API
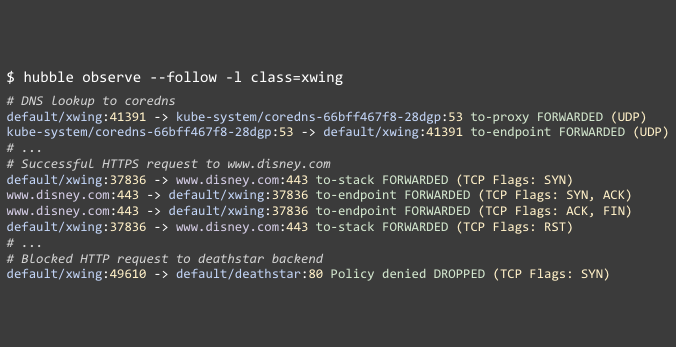
Hubble stores flows in an in-memory database that you can then query to troubleshoot incidents or inspect network behavior, e.g. show me all drops in last 5 min
Examples below:
- DNS queries
- HTTP request/response
- Network policy drops
Hubble stores flows in an in-memory database that you can then query to troubleshoot incidents or inspect network behavior, e.g. show me all drops in last 5 min
Examples below:
- DNS queries
- HTTP request/response
- Network policy drops
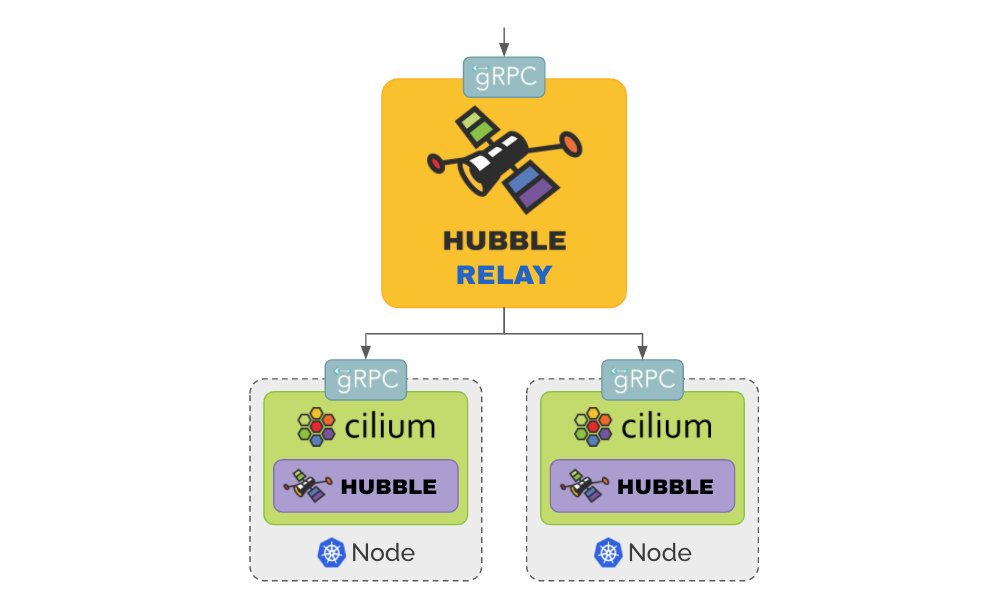
Relay provides an API to query network flows in the entire cluster.
tl;dr: tcpdump but on all k8s nodes at the same time.
More info:
https://docs.cilium.io/en/v1.9/hubble/#hubble-relay
tl;dr: tcpdump but on all k8s nodes at the same time.
More info:
https://docs.cilium.io/en/v1.9/hubble/#hubble-relay
UI (1/2)
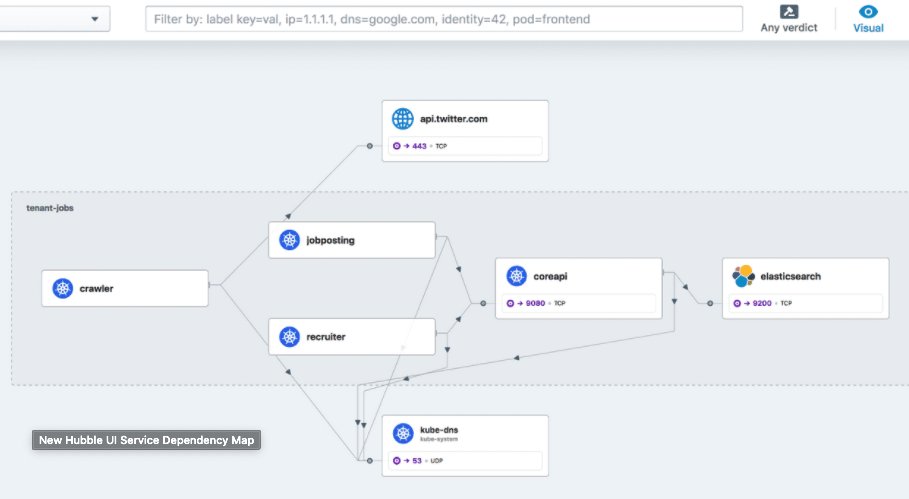
The UI runs on top of Relay and can visualize how your k8s services interact with each other.
Hubble UI repo:
https://github.com/cilium/hubble-ui
The UI runs on top of Relay and can visualize how your k8s services interact with each other.
Hubble UI repo:
https://github.com/cilium/hubble-ui
UI (2/2)
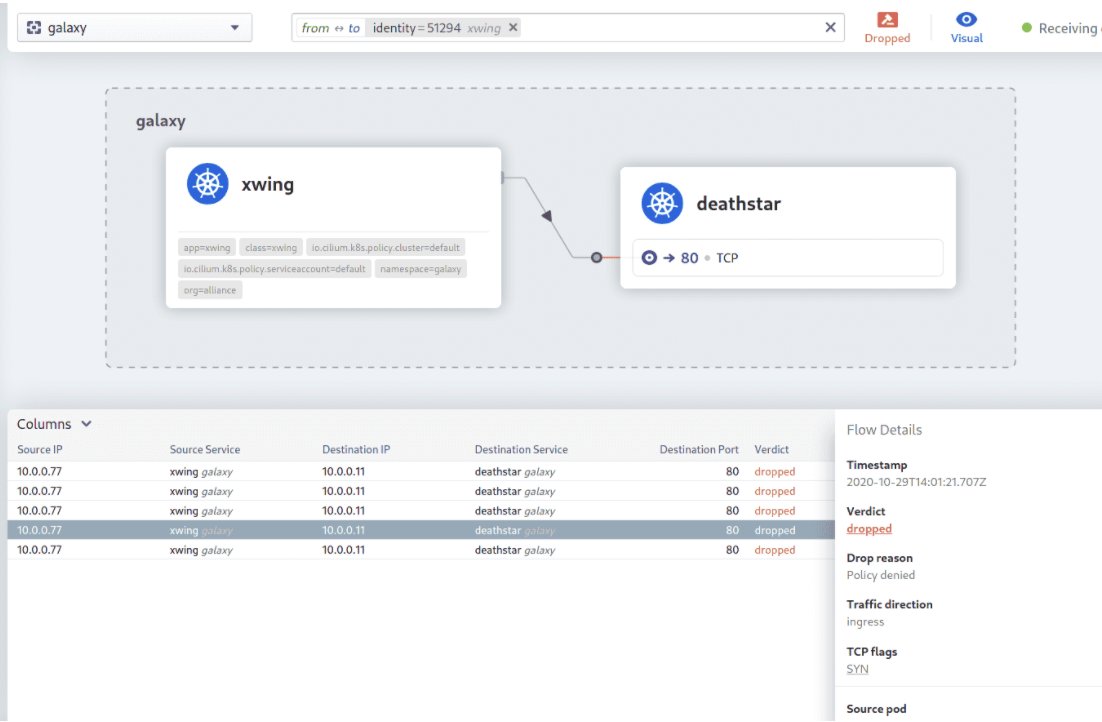
You can also use the UI to visualize drops. Here, the UI will visualize all NetworkPolicy drops from and to a deployment "xwing". The graphical representation will stay on deployment level, the detailed flow view will help you identify individual pod instances.
You can also use the UI to visualize drops. Here, the UI will visualize all NetworkPolicy drops from and to a deployment "xwing". The graphical representation will stay on deployment level, the detailed flow view will help you identify individual pod instances.
Further reading:
- Getting started: https://docs.cilium.io/en/v1.9/gettingstarted/hubble/
- Hubble KubeCon 2020 talk:
- Getting started: https://docs.cilium.io/en/v1.9/gettingstarted/hubble/
- Hubble KubeCon 2020 talk:

 Read on Twitter