1/ Other Coronaviruses (non-COVID19) vs. #COVID19 in Canada
Comparing %pos by week for past cold seasons vs. the 2019/2020 Novel Coronavirus season.
Three provinces: ONT, QUE, BC
I honestly don’t know how to interpret what I’m seeing but it’s eye popping to say the least...
Comparing %pos by week for past cold seasons vs. the 2019/2020 Novel Coronavirus season.
Three provinces: ONT, QUE, BC
I honestly don’t know how to interpret what I’m seeing but it’s eye popping to say the least...
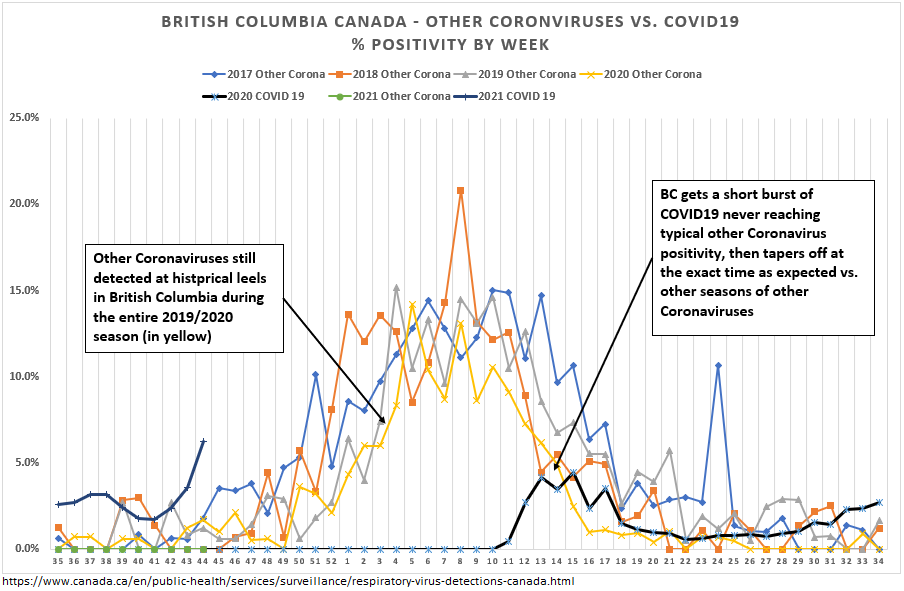
2/ BC…
Appears to have had a normal cold season (other coronaviruses) in 2019/2020 (yellow line) compared to the prior three seasons.
#COVID19 arrives (dark black line, surges weeks 11-14), and declines (seasonally, it would appear).
Appears to have had a normal cold season (other coronaviruses) in 2019/2020 (yellow line) compared to the prior three seasons.
#COVID19 arrives (dark black line, surges weeks 11-14), and declines (seasonally, it would appear).
3/ but Ontario and Quebec are way different…
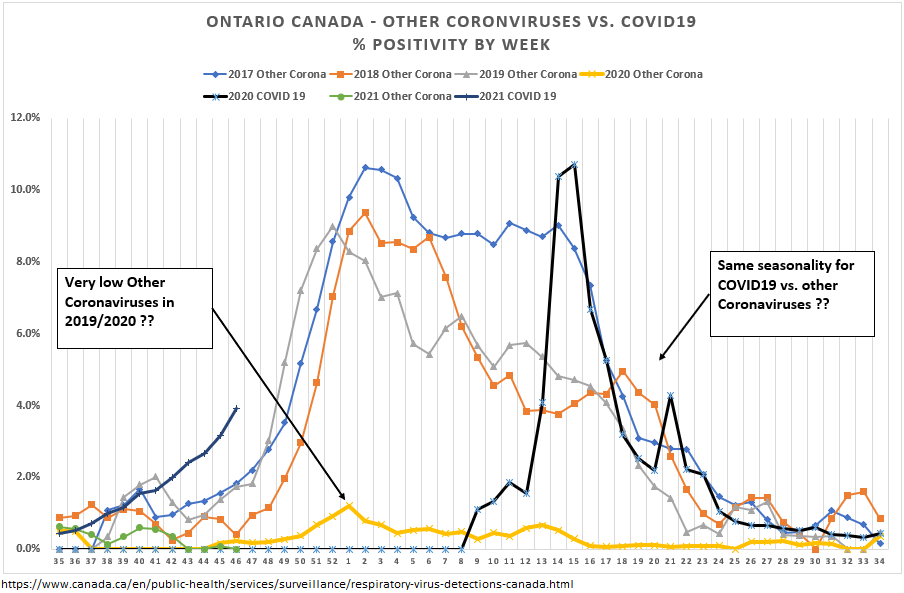
4/ Ontario…
Where are the Other Coronaviruses in the ‘19/’20 season? (yellow line)
% pos does not rise as normally expected, and goes nowhere near the prior three seasons !
Material #COVID19 positives arrive again in week 11, and surge before declining (again, seasonally?).
Where are the Other Coronaviruses in the ‘19/’20 season? (yellow line)
% pos does not rise as normally expected, and goes nowhere near the prior three seasons !
Material #COVID19 positives arrive again in week 11, and surge before declining (again, seasonally?).
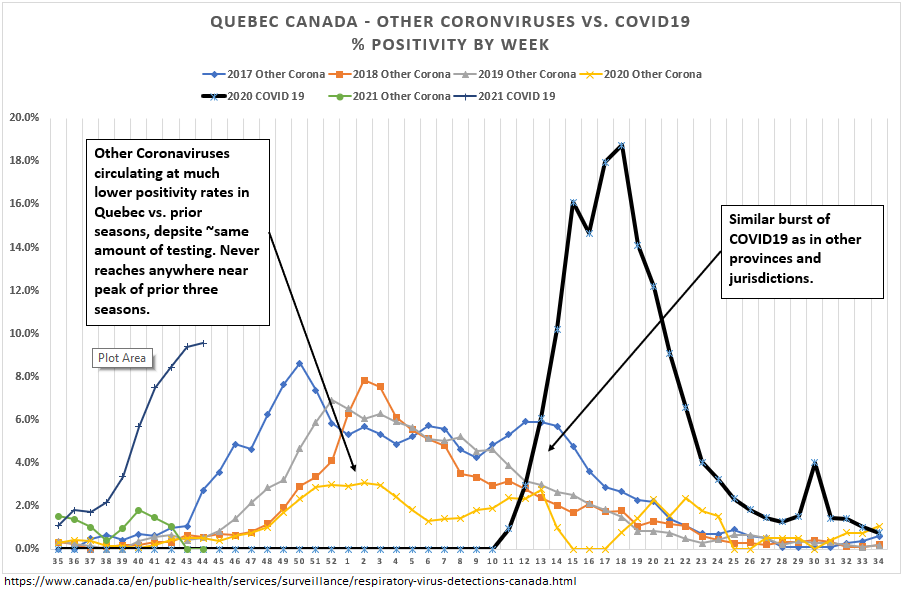
5/ What about Quebec ?
Well, there is some surge in Other Coronavirus % positivity in late 2019, then it plateaus, and it never comes close to prior year peaks.
#COVID19 again arrives in ~ week 11, surges before declining (again, seasonally?).
Well, there is some surge in Other Coronavirus % positivity in late 2019, then it plateaus, and it never comes close to prior year peaks.
#COVID19 again arrives in ~ week 11, surges before declining (again, seasonally?).
6/ This is just the data. Other Coronavirus testing levels were not materially different through the 2019/2020 season.
I have no idea how the above should be interpreted, but the obv Q: why is Other Coronavirus % pos in Ont/Que so low prior to the “official” arrival of #COVID19?
I have no idea how the above should be interpreted, but the obv Q: why is Other Coronavirus % pos in Ont/Que so low prior to the “official” arrival of #COVID19?
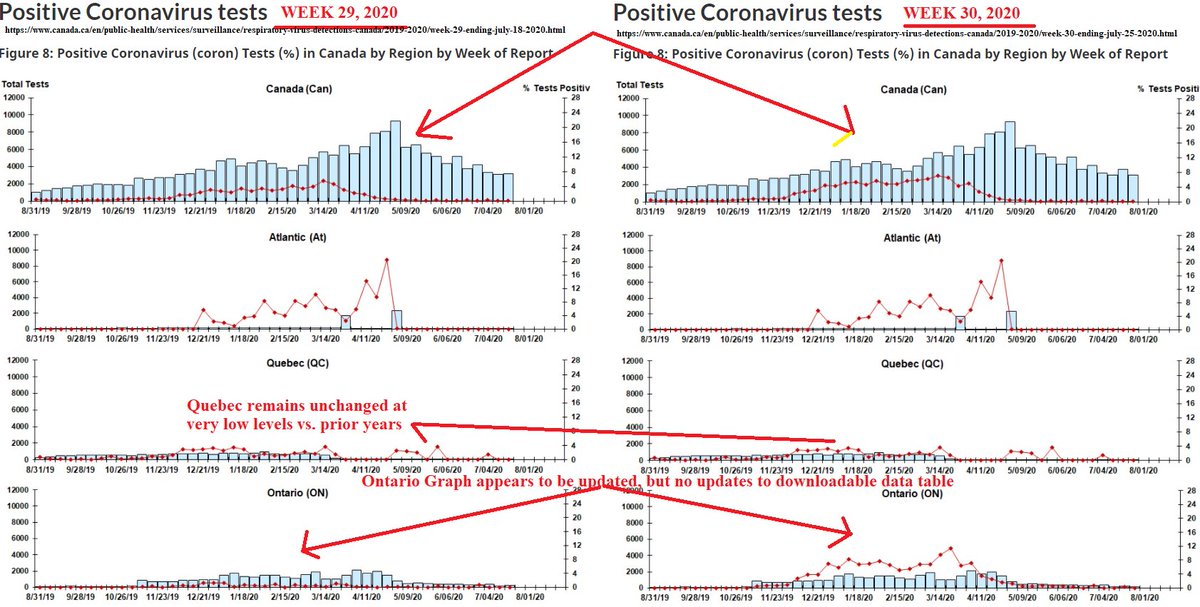
7/ A brief data note: in week 30 (July 25th, 2020), the other coronavirus chart (published weekly) for Ontario appeared to be updated so as to “catch up” previous unreported positives (??). But *no changes* were made to the official data table. And no changes to the Quebec chart.
8/ Sources. All data from:
https://www.canada.ca/en/public-health/services/surveillance/respiratory-virus-detections-canada.html
https://www.canada.ca/en/public-health/services/surveillance/respiratory-virus-detections-canada.html
9/ Fascinating data. End Thread.

 Read on Twitter


