1/ Thanks to help from @Poppendieck & @CorsIAQ, I've used my @AranetIoT CO2 meter to estimate the # of air changes per hour (ACH) in my classroom. CO2 builds up when students are in a room & falls when they leave. Description & graphs below. #covidco2 @jljcolorado @ShellyMBoulder
2/ If you record the CO2 level each minute after the room empties, plug those measurements into the formula pictured below, and graph the resulting values as a function of time (designated in hours), the slope of a linear best-fit line reveals the ACH. @MarcelHarmon1 @CathNoakes
3/ So the rate of change of the CO2 level functions as a proxy measurement for ventilation. I trust if you’ve made it this far, you are aware of the vital importance of ventilation in preventing aerosol-spread pathogens like SARS-CoV-2. @akm5376 @jksmith34 @stephensbrent
4/ See the following excellent & comprehensive FAQ (by @jljcolorado @ShellyMBoulder @kprather88 @WBahnfleth @linseymarr @PollittKrystal @CorsIAQ & others) if you aren’t familiar with the importance of ventilation & the aerosol spread of SARS-CoV-2. https://docs.google.com/document/d/1fB5pysccOHvxphpTmCG_TGdytavMmc1cUumn8m0pwzo/edit
5/ Below I’ll describe my process & methods, but first I should say that I’ve never done this before & likely made some mistakes. I welcome feedback & suggestions from anyone with more experience & knowledge in these matters. @dylanhmorris @Don_Milton @MicroLevitator
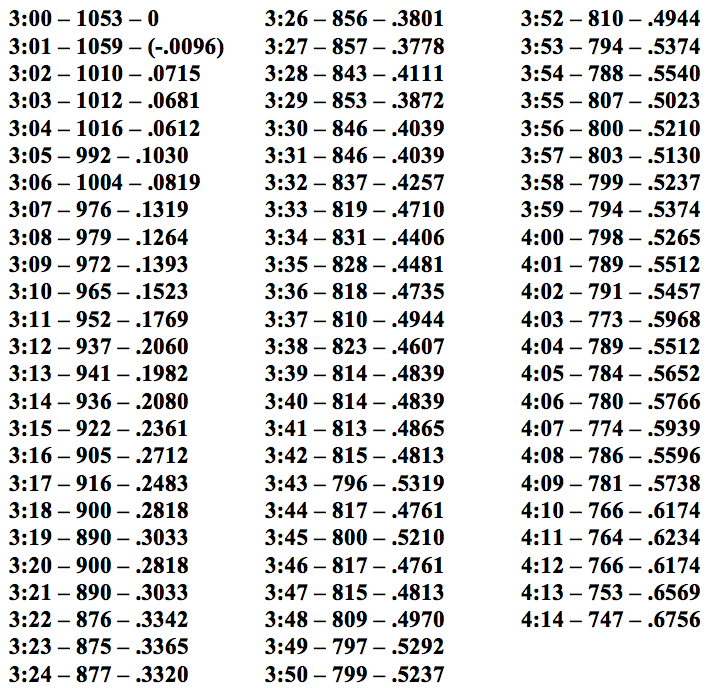
6/ I did several trials, some after dismissal at the end of the school day & some when students left the room for lunch. I recorded CO2 levels every minute for at least 45 min each time, used the provided equation (below) to calculate y-values…
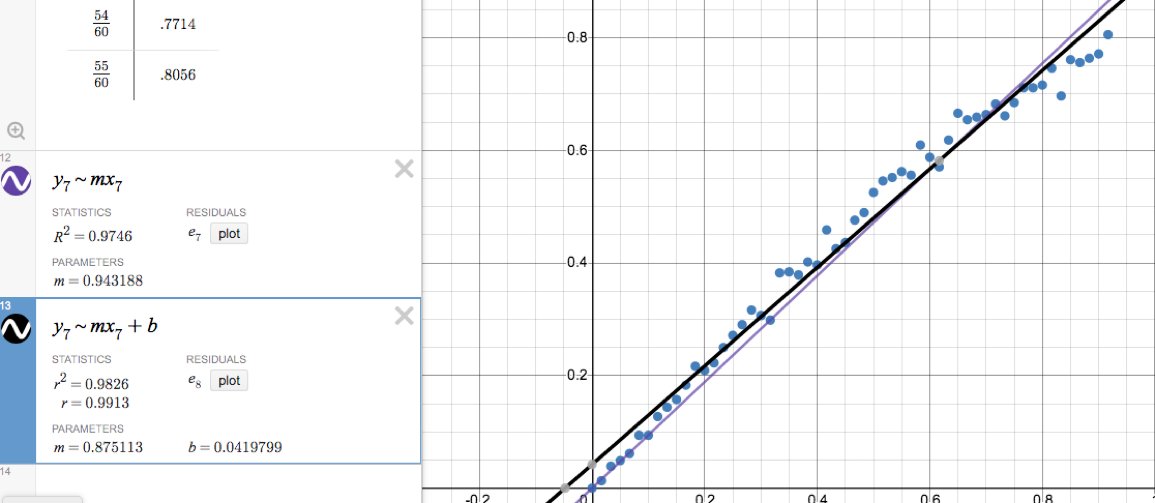
7/ …graphed the resulting data points using an online graphing calculator (Desmos), and asked the calculator to do a linear regression to find a best-fit line. The slope of this line represents the ACH. I’m not 100% certain what is meant by…
8/ “a best-fit line forced through the zero intercept.” I think it means to force the best-fit line through the origin, but since I wasn’t sure, I found best-fit lines both forced & not forced through the origin. It made a difference in the line’s slope & the calculated ACH.
9/ Here are data (Time—CO2 ppm—# of volumetric air changes/60) & graphs for one after school trial. I did short (26 min) & long (74 min) calculations. ACH values were .880 and .812 (forced & not forced through origin) for the short trial, .665 and .601 for the long.
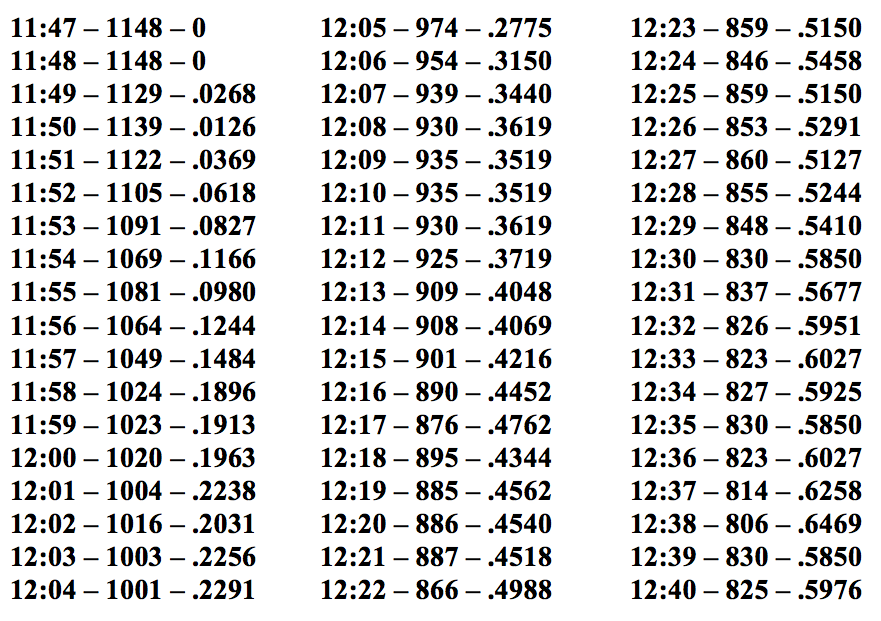
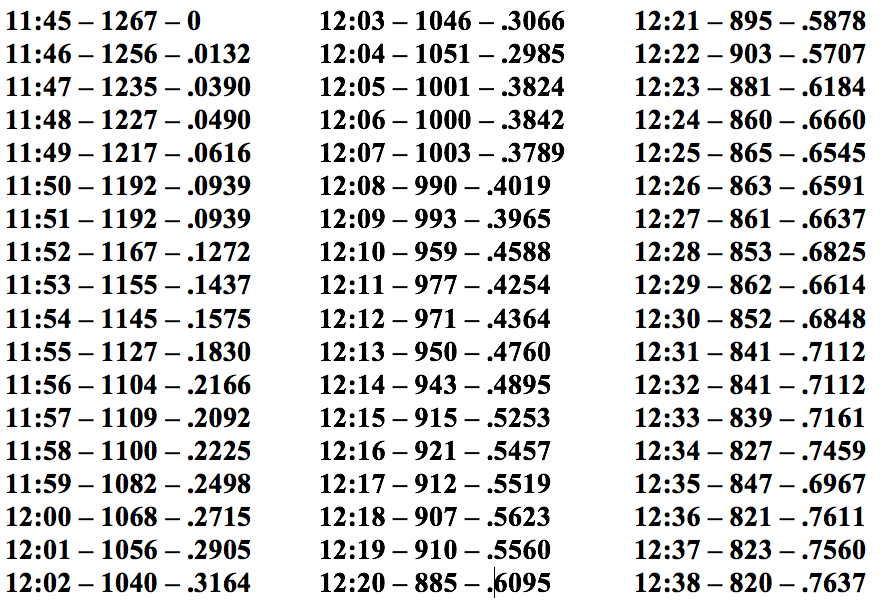
10/ And here are the data & graphs for my first lunchtime trial (53 minutes). Calculated ACH values were .802 and .735.
12/ One thing I noticed each time was that the ACH appears to flatten over time. I’m not sure if this is an expected result or not. I closed both doors to my classroom for all three trials.
13/ I was in the room for most of each trial, but I don’t think this has much effect. Early in the morning, the CO2 reading is about 440, & after I’ve been in the room for 45 minutes (alone) it hardly increases—by 10-20 ppm at most. I’m a good 18 feet away from the meter.
14/ I also have no idea if 0.7-0.9 ACH is typical for a classroom or public building. I know it’s not nearly enough though. That’s why I’ve spent over $1000 putting four HEPA filter air cleaners in my classroom that collectively deliver 1220 CADR.
15/ Those air cleaners provide the equivalent of 9.6 ACH, so I feel I’ve much improved the effective ventilation rate of my classroom and made it much safer for my students and myself. See this thread for more details on CO2 levels in my classroom. https://twitter.com/LongDesertTrain/status/1315207026461618176
End/ Again, I welcome feedback, suggestions, or corrections from anyone able to provide them. I'm a spreadsheet illiterate, so I did all the calculations individually and probably made a mistake here or there.

 Read on Twitter


