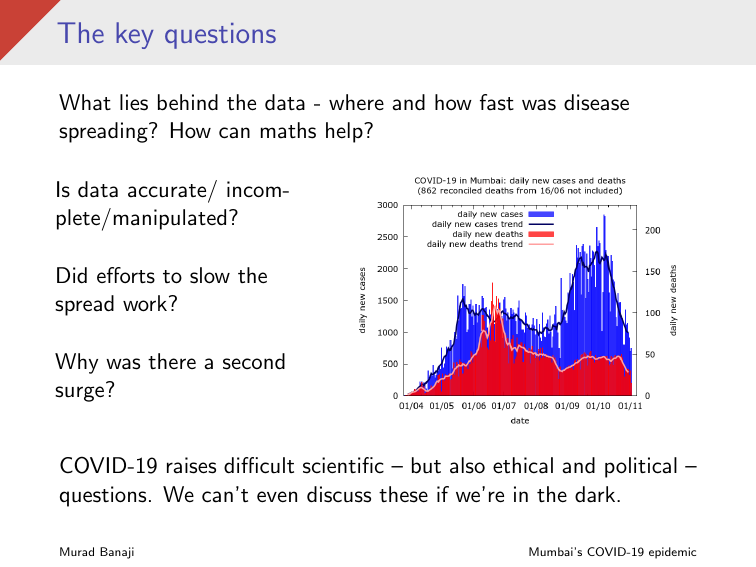
#COVID19 in Mumbai. Some slides (mildly edited) from a talk at Nottingham (thanks to @NabilFadai for the invite). A summary in this longish thread. Main themes:
- uneven spread (slums/non-slums)
- uneven detection
- fatalities
- the first and second waves
http://maths.mdx.ac.uk/research/modelling-the-covid-19-pandemic/mumbaiepidemic/
- uneven spread (slums/non-slums)
- uneven detection
- fatalities
- the first and second waves
http://maths.mdx.ac.uk/research/modelling-the-covid-19-pandemic/mumbaiepidemic/
First, the city's demographics:
- a young population (about 5% over 65).
- Roughly half live in slums, which have a younger age profile.
- Slums are distributed unevenly across the city's 24 wards.
- a young population (about 5% over 65).
- Roughly half live in slums, which have a younger age profile.
- Slums are distributed unevenly across the city's 24 wards.
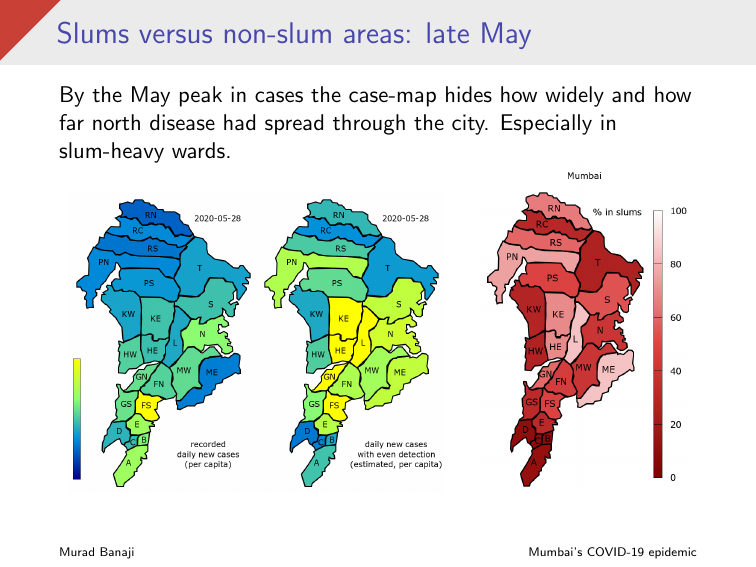
Cases (*recorded* infections) have predominantly reflected what's happening in the non-slum areas. We can try to separate slum and non-slum cases, and correct for poor detection in slum areas. We get a picture which is dramatically different from the picture of cases.
A snapshot of estimated cases and infections in late May (near the first peak in cases) shows how many cases were missed in slum-heavy wards like M/E, L, K/E and P/N. Disease had already spread north to slum-heavy wards like P/N, and even R/N, but the case map hides this.
We can follow this story in video form. During the first wave disease spread rapidly through slum areas. If we reconstruct the true picture, we see the rapid spread in slum wards in the first wave, and see disease reaching the northern suburbs earlier.
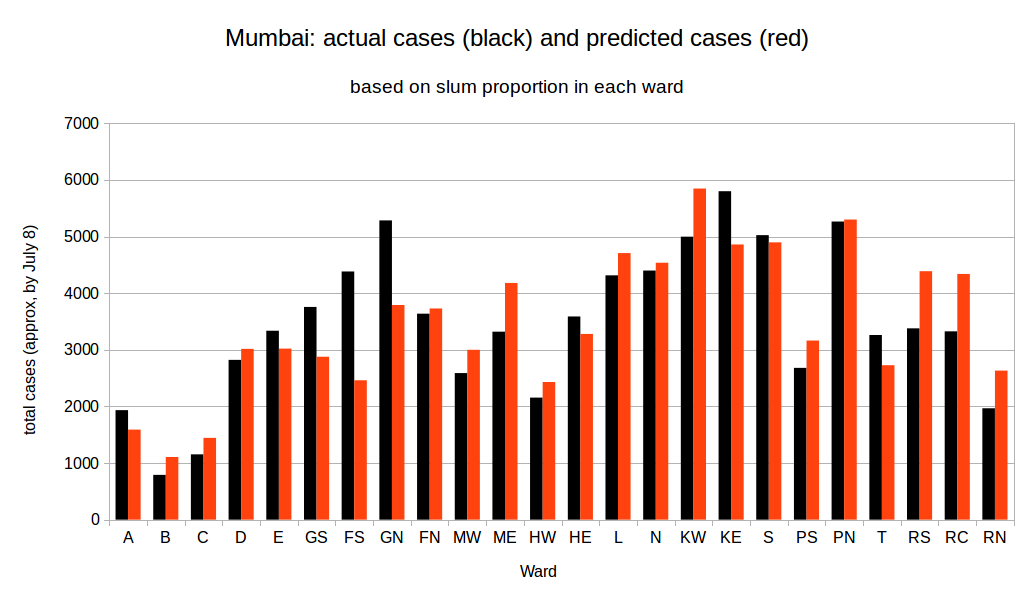
By the time of the first serosurvey (early July), cases in a ward were well predicted *just* from city-wide cases and slum-density of the ward. The picture was remarkably consistent. The outliers , are where disease hit early (e.g., F/S, G/N), or late (e.g. R/S, R/C and R/N) .
The second wave hit both slum and non-slum areas but:
- detection was by now better overall, and
- non-slum infections were a much bigger part of the total.
So daily cases were higher than in May, although daily infections were actually many fewer.
- detection was by now better overall, and
- non-slum infections were a much bigger part of the total.
So daily cases were higher than in May, although daily infections were actually many fewer.
Fatalities. Officially over 10K and counting. But the picture is complicated by
- missed deaths and a major reconciliation in June
- delayed reporting
- uneven spread through areas with different age structure
- missed deaths and a major reconciliation in June
- delayed reporting
- uneven spread through areas with different age structure
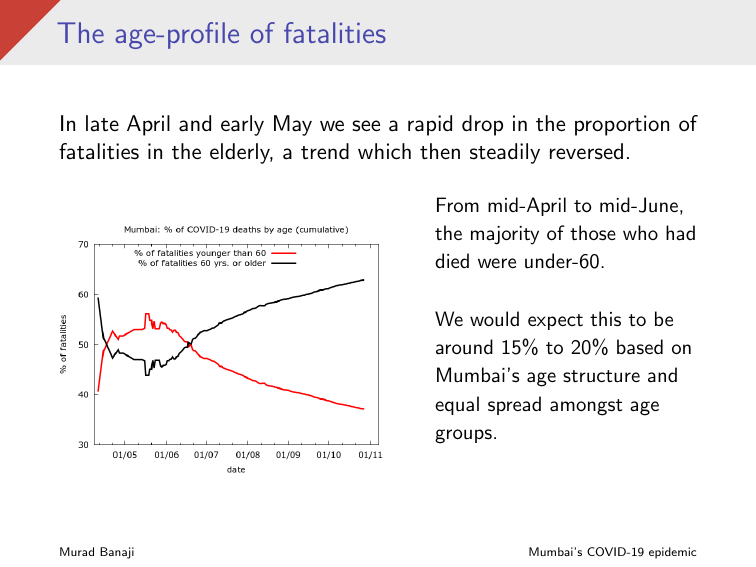
When disease raged in the slums the age-profile of fatalities dropped sharply. A lot of younger people were dying. As the slum wave receded, the age-profile of fatalities rose again.
A rough time-line:
Feb-March. Early undetected spread, starting in non-slum areas, but soon reaching the slums.
April-May. Disease spreads from south-central Mumbai northwards primarily in the slums.
June. Slum-heavy wards -- particularly in the north -- are still raging...
Feb-March. Early undetected spread, starting in non-slum areas, but soon reaching the slums.
April-May. Disease spreads from south-central Mumbai northwards primarily in the slums.
June. Slum-heavy wards -- particularly in the north -- are still raging...
...July-Aug. A lull, but non-slum areas still generate a stream of cases.
Sept-Oct. A surge in cases, probably driven by reopening, clearest in non-slum areas. In terms of infections, Surge 2 is similar in size to Surge 1 in non-slums, but much smaller than Surge 1 in the slums.
Sept-Oct. A surge in cases, probably driven by reopening, clearest in non-slum areas. In terms of infections, Surge 2 is similar in size to Surge 1 in non-slums, but much smaller than Surge 1 in the slums.
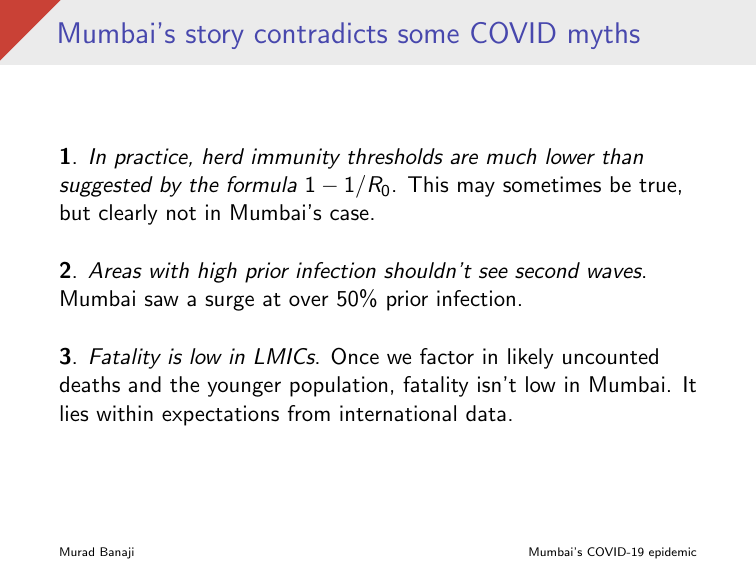
Three claims that Mumbai's data contradicts:
1. Herd immunity is reached at much below the theoretical value (i.e., 1-1/R0)
2. Cities with high prior infection can't see second waves
3. Fatality is low in LMICs.
1. Herd immunity is reached at much below the theoretical value (i.e., 1-1/R0)
2. Cities with high prior infection can't see second waves
3. Fatality is low in LMICs.
Finally, will there be another surge this winter (as in Delhi)? We can't rule it out because some areas still have relatively low prevalence. But it is less likely to occur. If it does, then in real terms (new infections), it should be smaller than the first two waves. (n/n)

 Read on Twitter