Check out our new paper in @nature, “Mobility network models of COVID-19 explain inequities and inform reopening”! https://www.nature.com/articles/s41586-020-2923-3 @2plus2make5 @PangWeiKoh @jalinegerardin @beth_redbird @davidgrusky @jure 1/9
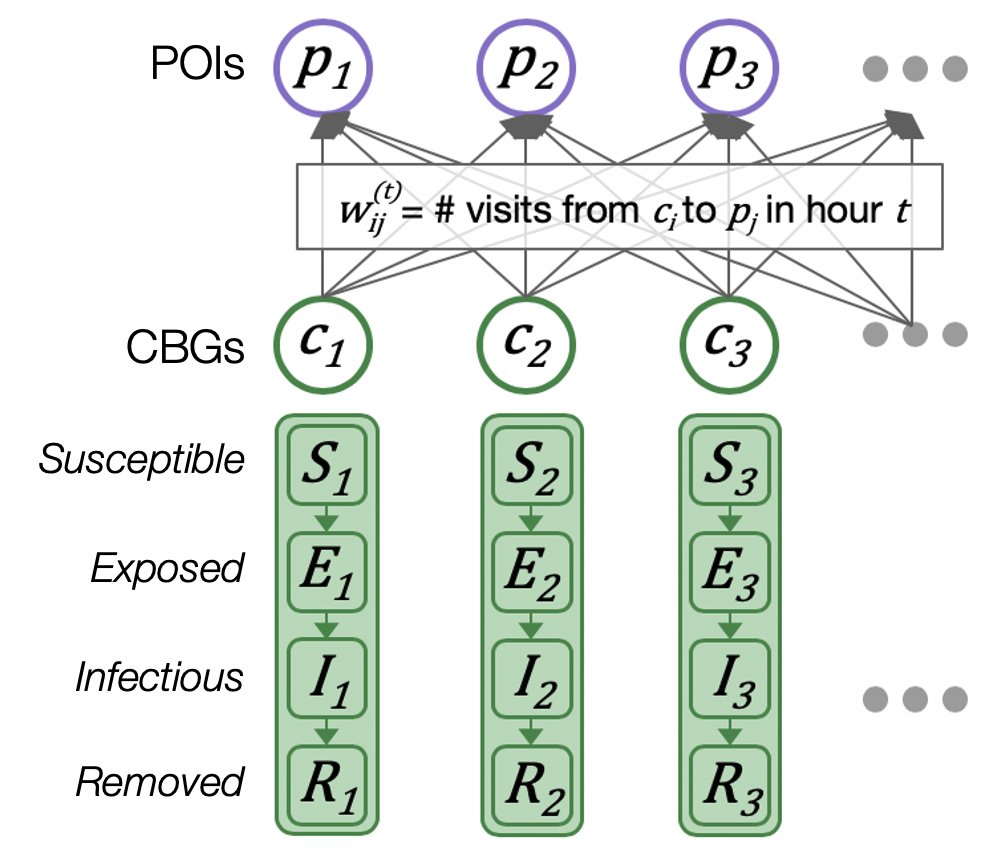
Using anonymized, aggregated location data from @SafeGraph, we construct mobility networks that capture the hourly movements of people from neighborhoods to points-of-interest (POIs) like restaurants and gyms. Our networks cover 553k POIs and 98M people from Mar-May 2020. 2/9
By overlaying a simple SEIR model on these networks, we're able to capture the broad relationship between mobility and disease spread. This allows us to assess a variety of reopening questions: which places are the riskiest to reopen? when/how should we reopen? 3/9
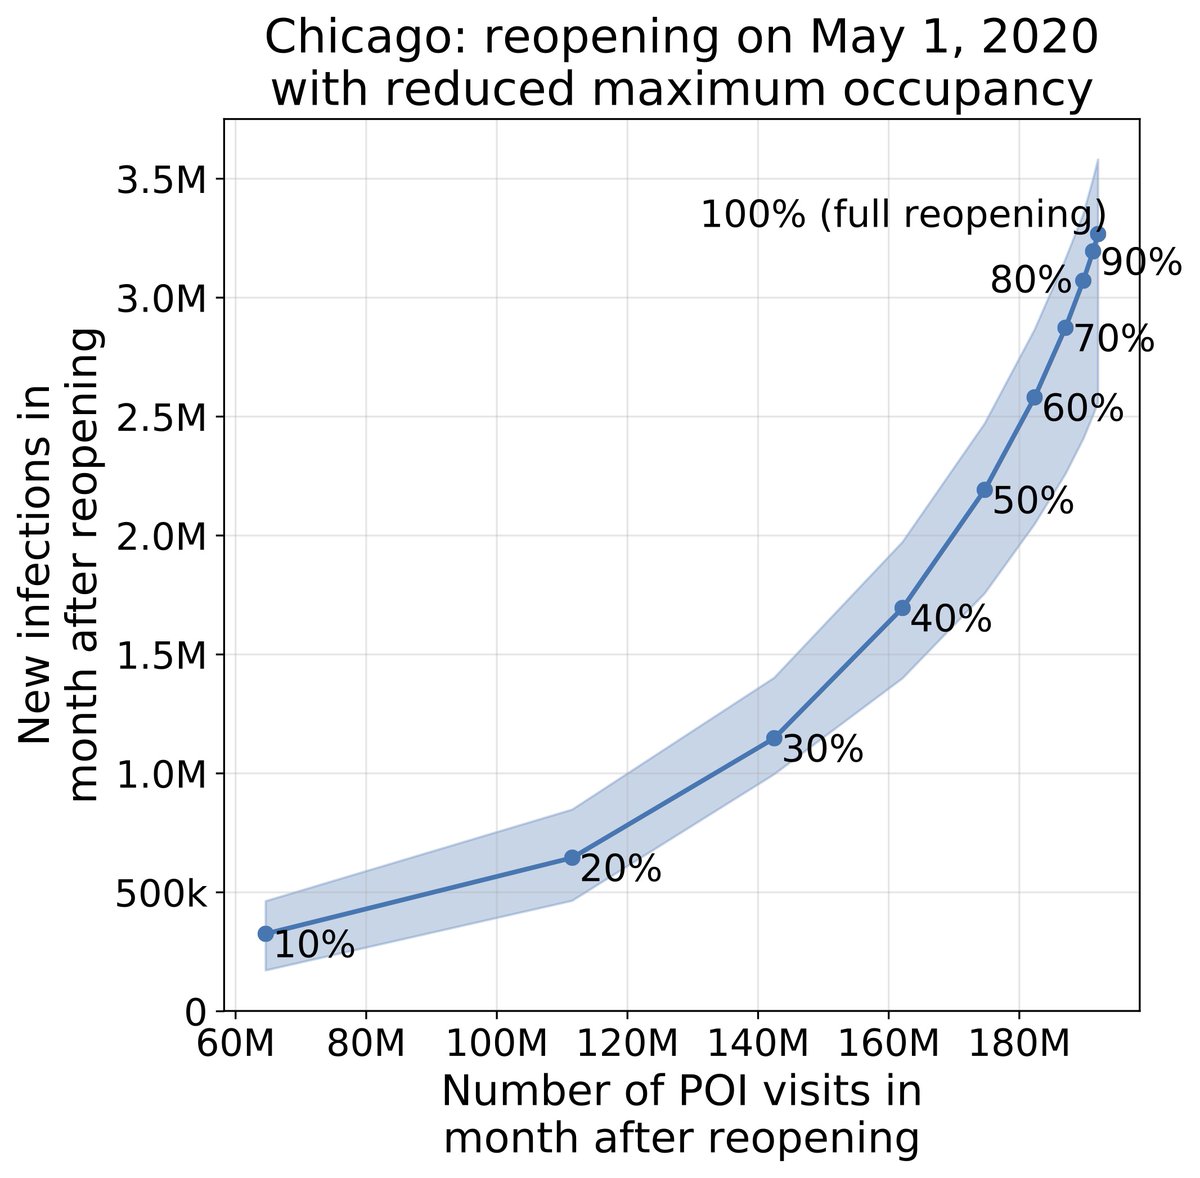
We find that reduced occupancy reopening — ie, reopening but capping each POI's max occupancy — is effective. In Chicago, our model predicts that capping at 20% occupancy reduces infections by more than 80% but only loses around 40% of POI visits, compared to fully reopening. 4/9
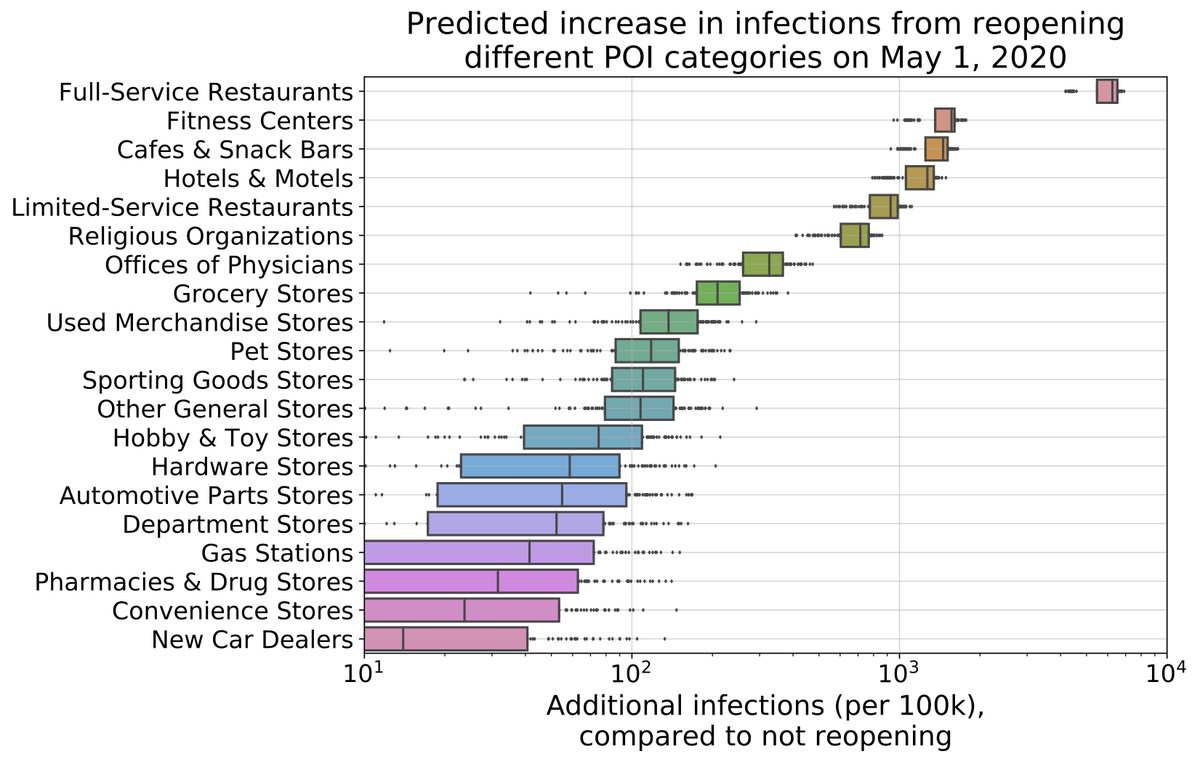
Our model also predicts that 10% of POIs account for over 80% of infections at POIs. Restaurants, gyms, hotels, and cages are among the riskiest categories to reopen. These places are riskier because they tend to have higher visitor densities and/or visitors stay longer. 5/9
Based on mobility data *alone*, the model correctly predicts that lower-income and less white neighborhoods are infected at higher rates. These disparities in COVID infection rates are well-reported, but this suggests that mobility may be a strong contributing factor. 6/9
We identify two mechanisms driving these disparities: (1) disadvantaged groups were not able to reduce their mobility as much in Mar 2020, (2) the POIs that disadvantaged groups visit tend to be more crowded, which increases risk of infection. 7/9
Our results highlight the need for policy-makers to consider the impacts of reopening on different populations. By supporting detailed, data-driven analyses, we hope that our model can help to address this need and inform more effective and equitable responses to COVID-19. 8/9
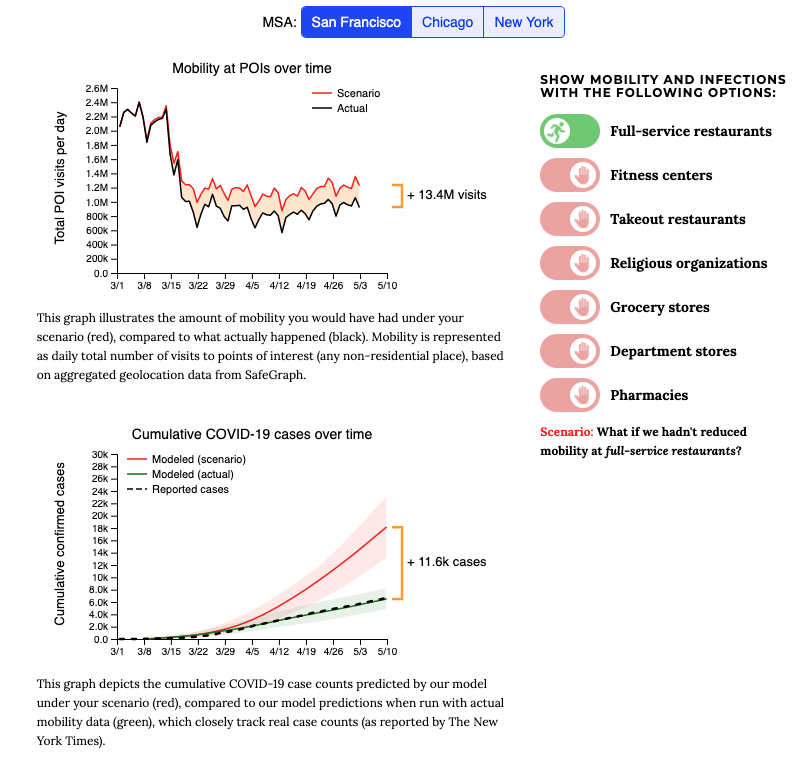
Check out the interactive simulation on our website ( http://covid-mobility.stanford.edu/ ) to learn more! Special thanks to @jdzamfi, @MarkWhiting, @jwkritchie, and @msbernst for building out the simulation frontend. 9/9

 Read on Twitter


