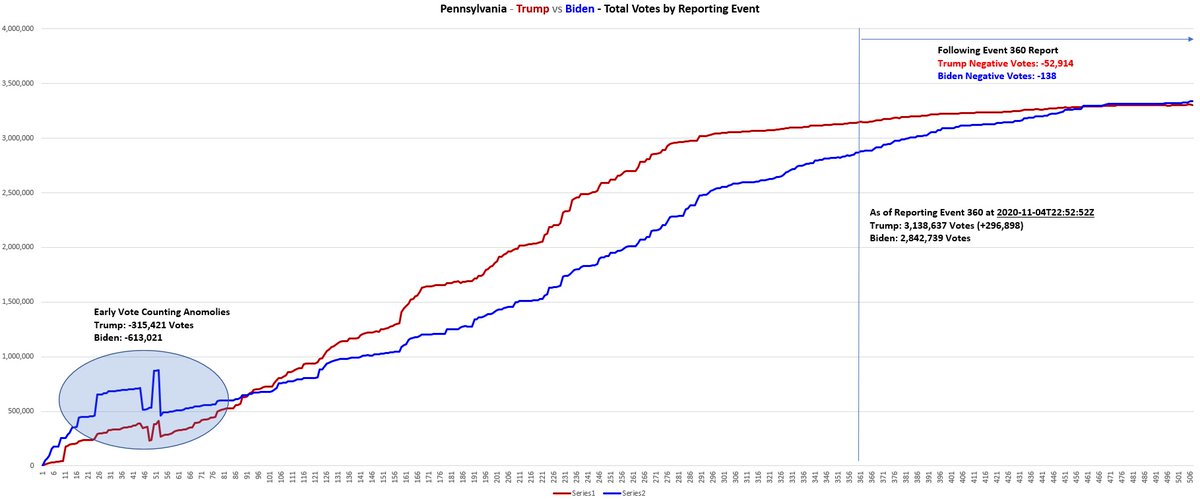
An interesting anomaly out of Pennsylvania
As of reporting event 360 @ 2020-11-04T22:52:52Z
Trump: 3,138,636 (+296,898)
Biden: 2,841,738
After this point:
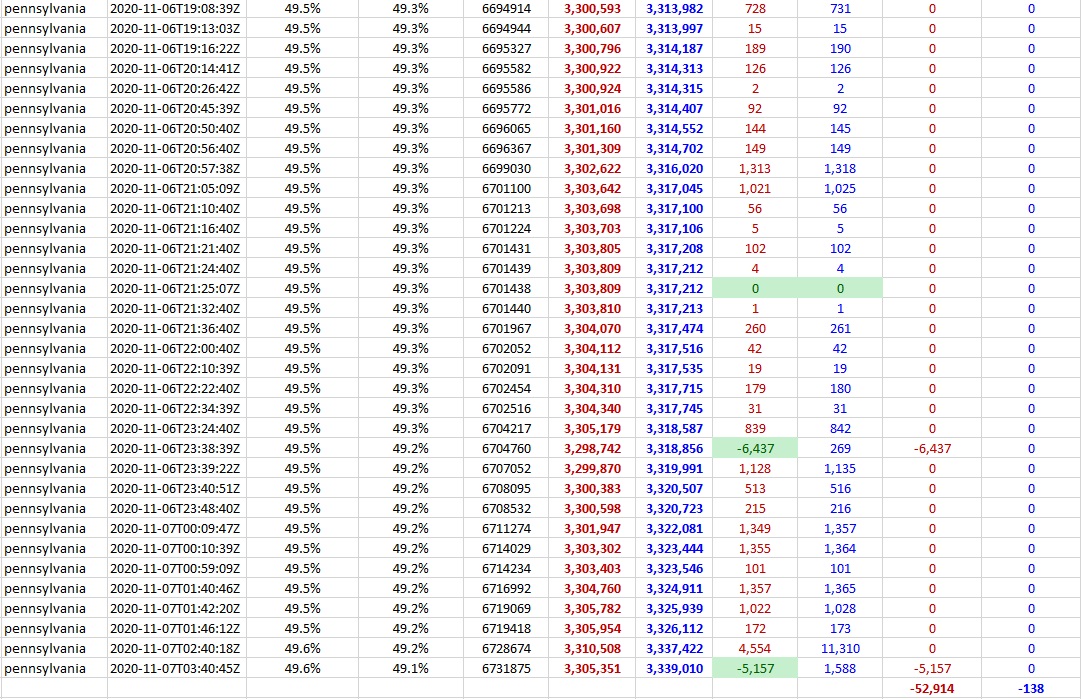
Trump had 52,913 negative votes
Biden had 138 negative votes
Difference of 52,775 is larger than Biden's 47,525 lead
1/5
As of reporting event 360 @ 2020-11-04T22:52:52Z
Trump: 3,138,636 (+296,898)
Biden: 2,841,738
After this point:
Trump had 52,913 negative votes
Biden had 138 negative votes
Difference of 52,775 is larger than Biden's 47,525 lead
1/5
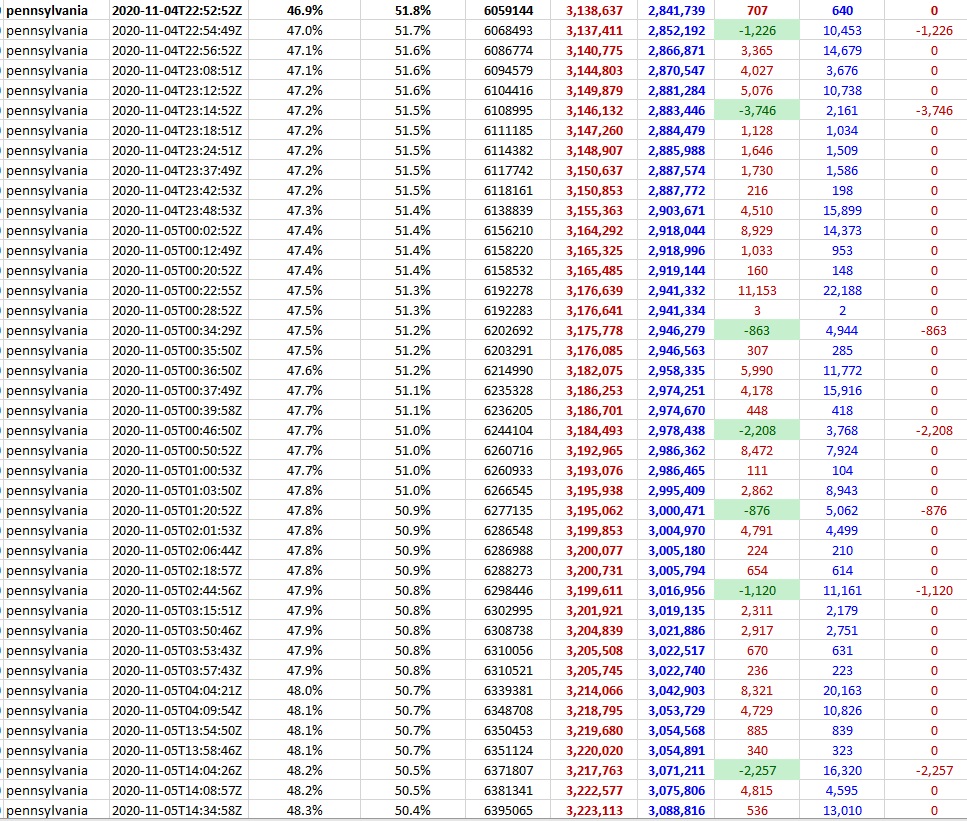
Here is the data (D1)
Red is Trump (T)
Blue is Biden (B)
Columns (L to R):
-State
-Date/Time
-% Dem Vote
-% Rep Vote
-Total Votes
-T Total Votes
-B Total Votes
-Difference T Votes from last report
-Difference T Votes from last report
-Negative T Votes
-Negative B Votes
2/5
Red is Trump (T)
Blue is Biden (B)
Columns (L to R):
-State
-Date/Time
-% Dem Vote
-% Rep Vote
-Total Votes
-T Total Votes
-B Total Votes
-Difference T Votes from last report
-Difference T Votes from last report
-Negative T Votes
-Negative B Votes
2/5
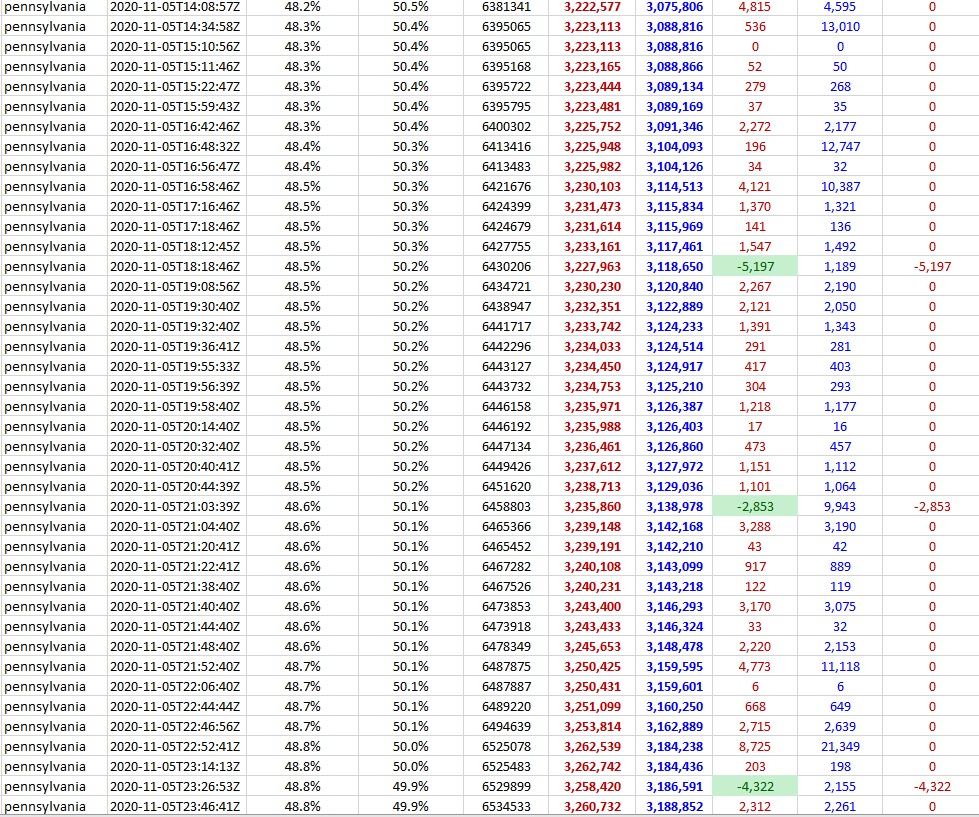
Here is D2
To be fair, overall in the state the tally was:
-Trump: 402,482 negative votes
-Biden: 637,931 negative votes
But most of this happened during early counting and spans a 9 report sequence so it indicates there was some confusion
In the 1st chart, I point to it
3/5
To be fair, overall in the state the tally was:
-Trump: 402,482 negative votes
-Biden: 637,931 negative votes
But most of this happened during early counting and spans a 9 report sequence so it indicates there was some confusion
In the 1st chart, I point to it
3/5
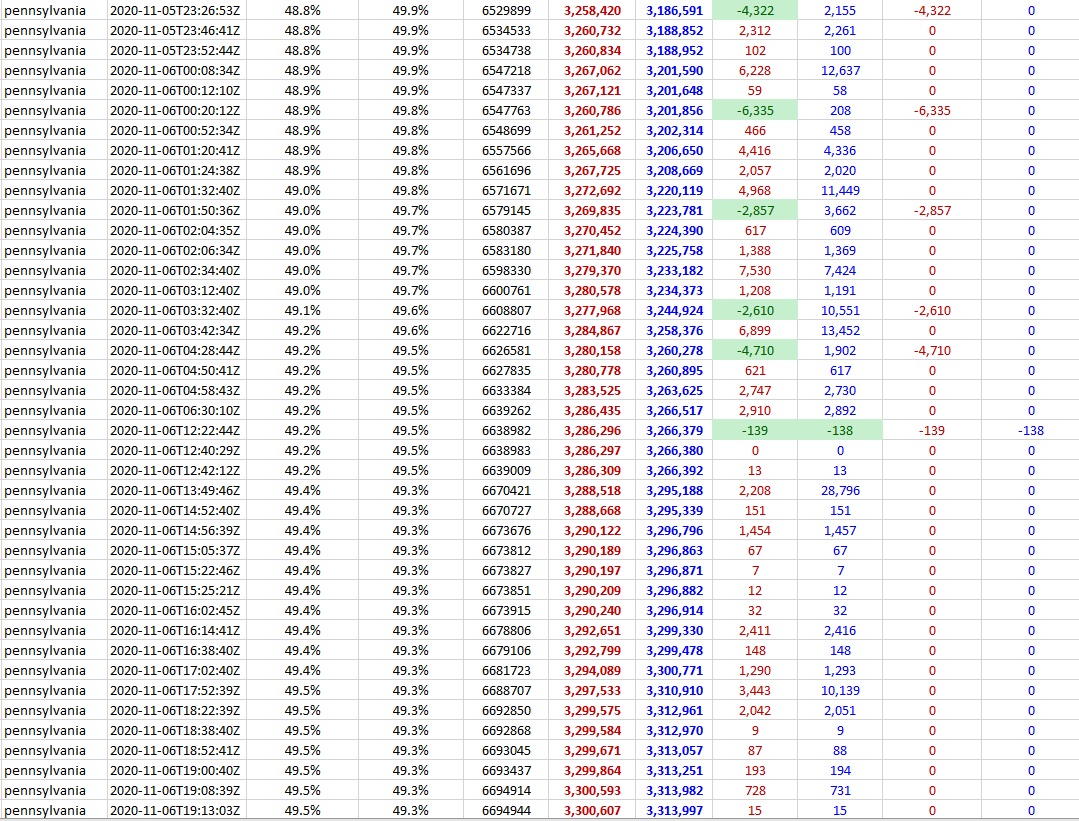
Here is D3
The source of this data is a "script to scrape the national ballot counting time series data of off the @nytimes
website"
https://twitter.com/APhilosophae/status/1325592112428163072?s=20
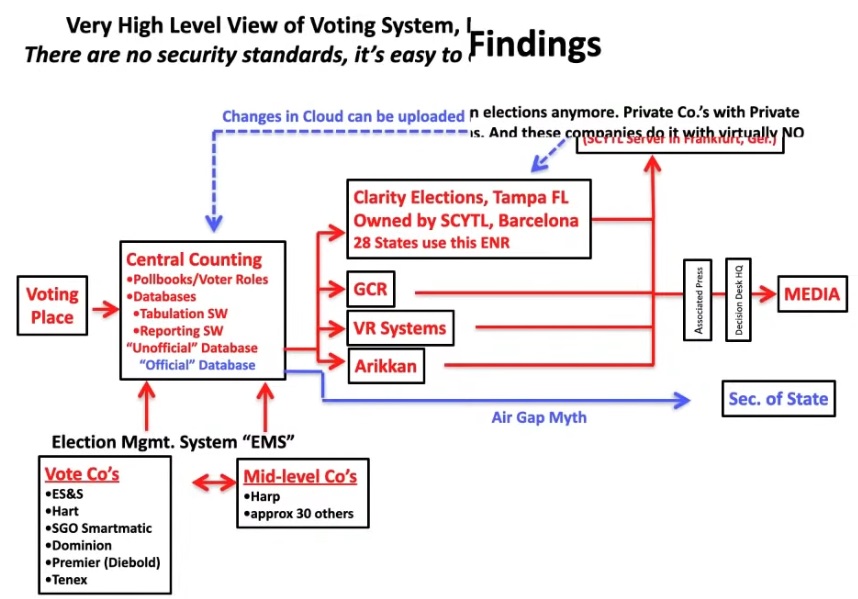
That data stream that the media gets is directly from the official voter databases (see graphic)
4/5
The source of this data is a "script to scrape the national ballot counting time series data of off the @nytimes
website"
https://twitter.com/APhilosophae/status/1325592112428163072?s=20
That data stream that the media gets is directly from the official voter databases (see graphic)
4/5
Here is D4
So what does it all mean?
I don't know so let's not jump to conclusions
But the numbers are what they are and again the question is why were the late differences in lost votes so high
Late vote losses in Michigan also broke against Trump -20,351 vs -1675 Biden
5/5
So what does it all mean?
I don't know so let's not jump to conclusions
But the numbers are what they are and again the question is why were the late differences in lost votes so high
Late vote losses in Michigan also broke against Trump -20,351 vs -1675 Biden
5/5

 Read on Twitter