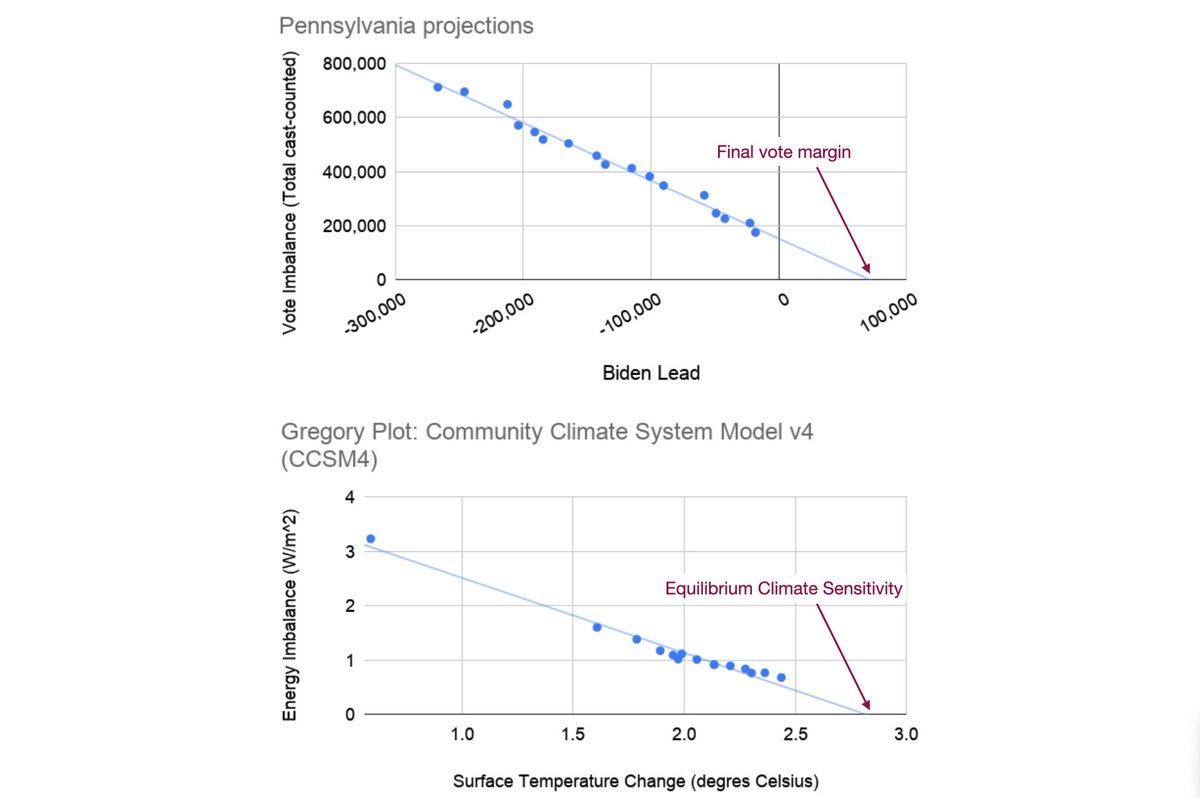
Teaching moments: what do electoral projections have in common with global warming projections?
Graphs below show
(a) Biden's vote lead vs Votes remaining (imbalance b/w cast vs counted votes)
(b)Global warming vs energy imbalance in CCSM4 (Gregory plot)
Looks similar?
1/
Graphs below show
(a) Biden's vote lead vs Votes remaining (imbalance b/w cast vs counted votes)
(b)Global warming vs energy imbalance in CCSM4 (Gregory plot)
Looks similar?
1/
What if we don't want to wait for all votes to be counted?
We can plot Biden's vote margin (horizontal axis) vs the vote imbalance, or votes cast-counted (vertical axis).
(you may see that same graph with the axis switched)
2/
We can plot Biden's vote margin (horizontal axis) vs the vote imbalance, or votes cast-counted (vertical axis).
(you may see that same graph with the axis switched)
2/
If the relationship is simple and linear we can extrapolate to estimate what will happen when all the votes are counted.
That's the point where the trendline intercepts the horizontal line that marks where vote imbalance=0
3/
That's the point where the trendline intercepts the horizontal line that marks where vote imbalance=0
3/
What about climate models? We would like to know how much the Earth will eventually warm if we double CO2. That quantity is called Equilibrium Climate Sensitivity (ECS).
But running a climate model to equilibrium is very expensive, and rarely done.
4/
But running a climate model to equilibrium is very expensive, and rarely done.
4/
So instead we make a Gregory plot: surface temperature change (horizontal axis) vs energy imbalance (vertical axis)
Why energy imbalance? Well, when we increase CO2 we trap more energy into the Climate System, which leads to a positive energy imbalance.
5/
Why energy imbalance? Well, when we increase CO2 we trap more energy into the Climate System, which leads to a positive energy imbalance.
5/
As long as there's surplus of energy going into the Earth (positive energy imbalance) the Earth will warm.
Equilibrium is reached when energy going in = energy going out.
Sort of like a winner is reached when votes cast = votes counted.
6/
Equilibrium is reached when energy going in = energy going out.
Sort of like a winner is reached when votes cast = votes counted.
6/
So, if we extrapolate the relationship between global warming and energy imbalance to where the energy imbalance is zero we can estimate the Equilibrium Climate Sensitivity.
7/
7/
Furthermore, for both projections we worry about linearity:
Is that relationship between vote imbalance (or energy imbalance) and vote margin (or surface temperature) truly linear? Or is there a kink down the line?
Thinking about kinkiness is what keeps me up at night.
8/
Is that relationship between vote imbalance (or energy imbalance) and vote margin (or surface temperature) truly linear? Or is there a kink down the line?
Thinking about kinkiness is what keeps me up at night.
8/
So what can lead to a kink in the line? In climate we call it "pattern effect". The relationship b/w temperature and energy imbalance depends on where you warm.
Same with votes: the vote margin depends on where the votes are coming from.
9/
Same with votes: the vote margin depends on where the votes are coming from.
9/
If you warm in the tropical regions, you can radiate a lot of energy to space and close the energy imbalance quickly.
Similarly, if you're counting votes from Philadelphia, you're going to ramp up Biden's vote margin quickly.
10/
Similarly, if you're counting votes from Philadelphia, you're going to ramp up Biden's vote margin quickly.
10/
So for both climate and votes, you really want to make sure you know (a) the pattern - where the warming/votes are going to be coming from and (b) what the relationship between votes and margin (warming and radiation) in each region look like.
11/
11/
It gets more complicated with climate because warming in one region can affect radiation in a different region.
It also gets complicated with votes since we may not know how many uncounted votes there really are
But I'll stop here.
12/12 (end)
It also gets complicated with votes since we may not know how many uncounted votes there really are
But I'll stop here.
12/12 (end)

 Read on Twitter


