AP called it for McConnell. With about 95% in he led McGrath 58% to 38%.
???? - 1,678,538 Dems registered, McGrath 793,729?
Yesterday 3:02 PM EST, 98% of the vote in:
McConnell 1,222,749
McGrath 793,729 (can't be right)
Brad Barron 83,826
???? - 1,678,538 Dems registered, McGrath 793,729?
Yesterday 3:02 PM EST, 98% of the vote in:
McConnell 1,222,749
McGrath 793,729 (can't be right)
Brad Barron 83,826
Again, record-breaking registrations, 1,678,538 Dems & only 750,597 for Biden?
Trump 1,315,457
Biden 750,597 (can't be right)
Jorgensen (LB) 26,459
West (I) 6,259
Pierce (I) 3,498
Trump 1,315,457
Biden 750,597 (can't be right)
Jorgensen (LB) 26,459
West (I) 6,259
Pierce (I) 3,498
1.6 million Dems registered in KY, but half or less voted??? I do Not believe that.
@OversightDems Oversight KY totals
@HouseDemocrats @TheBlackCaucus @HouseDemWomen @SenateDems @DemGovs
* Dem votes Had to be Suppressed.
@OversightDems Oversight KY totals
@HouseDemocrats @TheBlackCaucus @HouseDemWomen @SenateDems @DemGovs
* Dem votes Had to be Suppressed.
Bottom line -
KY - 1,678,538 registered Dems -
Less than half voted after record-breaking registrations?
Biden 750,597 (can't be right)
McGrath 793,729 (can't be right)
KY - 1,678,538 registered Dems -
Less than half voted after record-breaking registrations?
Biden 750,597 (can't be right)
McGrath 793,729 (can't be right)
Can't let this go.
1,477,985 Republicans are registered in KY
Trump got 89.0% of that number
McConnell got 82.7%
1,678,538 Democrats are registered in KY
Biden got 44.74% of that number
McGrath got 47.29%
1,477,985 Republicans are registered in KY
Trump got 89.0% of that number
McConnell got 82.7%
1,678,538 Democrats are registered in KY
Biden got 44.74% of that number
McGrath got 47.29%
Why did Democrats get less than 50% the number of registered Democrats while Republicans got nearly 90% the number of registered Republicans?
Somebody in Kentucky is keeping Democrats from voting.
@OversightDems - Oversight.
@HouseDemocrats @TheBlackCaucus @SenateDems @DemGovs
Somebody in Kentucky is keeping Democrats from voting.
@OversightDems - Oversight.
@HouseDemocrats @TheBlackCaucus @SenateDems @DemGovs
Pulled sources as I went. Didn't think I'd find anything, so didn't do it offline first. Here's the sources in the sequence I pulled them:
1. Kentucky Early Voting Statistics
Last Report: 11/1/2020
https://electproject.github.io/Early-Vote-2020G/KY.html
1. Kentucky Early Voting Statistics
Last Report: 11/1/2020
https://electproject.github.io/Early-Vote-2020G/KY.html
2. Kentucky breaks record for total number of registered voters
Updated: 5:28 PM EST Feb 18, 2020 https://www.wlwt.com/article/kentucky-breaks-record-for-total-number-of-registered-voters/30986888
Updated: 5:28 PM EST Feb 18, 2020 https://www.wlwt.com/article/kentucky-breaks-record-for-total-number-of-registered-voters/30986888
3. Mitch McConnell defeats Democrat Amy McGrath to keep his seat in the Senate
(Morgan Watkins, Louisville Courier Journal) https://www.indystar.com/story/news/politics/elections/kentucky/2020/11/03/mitch-mcconnell-wins-over-democratic-challenger-amy-mcgrath/6074895002/
(Morgan Watkins, Louisville Courier Journal) https://www.indystar.com/story/news/politics/elections/kentucky/2020/11/03/mitch-mcconnell-wins-over-democratic-challenger-amy-mcgrath/6074895002/
3. (cont'd)
"Mitch McConnell defeats Democrat Amy McGrath to keep his seat in the Senate" article published first in
Louisville Courier Journal
Morgan Watkins
Published 8:06 PM ET Nov 3, 2020 / Updated 5:55 AM ET, Nov 4, 2020 https://www.courier-journal.com/story/news/politics/elections/kentucky/2020/11/03/mitch-mcconnell-wins-over-democratic-challenger-amy-mcgrath/6074895002/
4. 2020 Presidential Election Results & Electoral Map
Election Date: Nov. 3, 2020 | Updated 12:37 AM EST Nov. 6, 2020
https://www.usatoday.com/elections/results/2020-11-03/presidential/
Election Date: Nov. 3, 2020 | Updated 12:37 AM EST Nov. 6, 2020
https://www.usatoday.com/elections/results/2020-11-03/presidential/
That's it for sources.
Forgot one.
KY state spreadsheet for 2016 registration numbers (Jan 2017). Compared w/ 2020.
https://elect.ky.gov/Resources/PublishingImages/Pages/Registration-Statistics/voterstats-20170120-180338.xls
KY state spreadsheet for 2016 registration numbers (Jan 2017). Compared w/ 2020.
https://elect.ky.gov/Resources/PublishingImages/Pages/Registration-Statistics/voterstats-20170120-180338.xls
Another one. This is too much.
786,283 more registered than can vote?
3,462,152 Registered 2020
- 2,675,869 Voting age (calculated from Census & BLS)
786,283 more registered than can vote?
3,462,152 Registered 2020
- 2,675,869 Voting age (calculated from Census & BLS)
Teasing out the number of Democrats & Republicans isn't easy. For instance, KY Public Radio interviewed uky's director of Institute for Rural Journalism and Community Issues on 6/20/2018 who said many conservative voters have still been registered as Democrats.
They do so to have a say in local primary elections still dominated by Democratic candidates. "It’s just a statement when you go change your registration. If your family has been registered Dem since the Civil War, then that is your party of heritage.
To change your registration is to step outside the box.”
In the 2008 Democratic primary, race was an issue. 19% of whites said race was a factor in who they decided to vote for. Hillary Clinton ended up more than doubling Obama’s votes in Kentucky, winning by 64% to 30%.
In the 2008 Democratic primary, race was an issue. 19% of whites said race was a factor in who they decided to vote for. Hillary Clinton ended up more than doubling Obama’s votes in Kentucky, winning by 64% to 30%.
"As of June 15 (2018) Democrats make up 49.9 percent of registered voters in Kentucky while Republicans make up 41 percent and the rest identify either with a third party or as independents."
Questions remain.
Questions remain.
Kentucky State Board of Elections election statistics -
Turnout Statistics -
"Disclaimer: The turnout report cannot accurately be compared to the election results page due to the fact the turnout report is run after the Kentucky Voter Registration rolls reopen.
Turnout Statistics -
"Disclaimer: The turnout report cannot accurately be compared to the election results page due to the fact the turnout report is run after the Kentucky Voter Registration rolls reopen.
The discrepancy in the numbers are the results of voters who have moved out of state, moved to another county, or are purged for being a convicted felon, incompetent, and deceased. Also, the State Board of Elections scans the precinct signature rosters which is not 100% accurate.
The discrepancy in the numbers reflect these changes within the county voter registration.
Please consider the turnout statistics as an unofficial document. Official documentation can be obtained from the County Clerk's office."
so, the state isn't official.
is this America?
Please consider the turnout statistics as an unofficial document. Official documentation can be obtained from the County Clerk's office."
so, the state isn't official.
is this America?
June 22, 2020 - "Kentucky election expected to be a "disaster" after polling locations cut: voting rights advocates - Jefferson County has a population of roughly 767,000 and will have just one polling location"
"a federal judge denied an effort to expand the number of polling places in Kentucky."
The June 23 primary will have "[f]ewer than 200 polling places," reported the Washington Post, "down from 3,700 in a typical election year."
(this leading up to the general election.)
The June 23 primary will have "[f]ewer than 200 polling places," reported the Washington Post, "down from 3,700 in a typical election year."
(this leading up to the general election.)
in 11:35pm, 11/8/2020 Tweet
"Teasing out the number of Democrats & Republicans isn't easy." Left off link. sorry.
https://wfpl.org/democrats-no-longer-majority-of-registered-voters-in-kentucky/
"Democrats No Longer Majority Of Registered Voters In Kentucky"
June 20, 2018
"Teasing out the number of Democrats & Republicans isn't easy." Left off link. sorry.
https://wfpl.org/democrats-no-longer-majority-of-registered-voters-in-kentucky/
"Democrats No Longer Majority Of Registered Voters In Kentucky"
June 20, 2018
Folks, going in circles. The state election office says counties have official numbers. Counties aren't saying.
There's little else I can do, so I have no choice but to withdraw from the chase. Sorry for causing an uproar, then not bringing it to a resolution.
There's little else I can do, so I have no choice but to withdraw from the chase. Sorry for causing an uproar, then not bringing it to a resolution.
this -
Michael Adams, Kentucky Secretary of State, said nearly 3,000 absentee ballots have been invalidated, but more than 1,000 of those were corrected or "cured."
Voters have until Nov. 9 to cure their ballots, which means it could take longer to accurately tally all votes.
Michael Adams, Kentucky Secretary of State, said nearly 3,000 absentee ballots have been invalidated, but more than 1,000 of those were corrected or "cured."
Voters have until Nov. 9 to cure their ballots, which means it could take longer to accurately tally all votes.
Too many more anomalies. Can't withdraw.
Top 3 states take more out of govt than they pay in.
State Receipts Expenditures Bal of Pmts
Virginia 86,367 183,282 96,914
Maryland 63,520 111,456 47,937
Kentucky 31,983 77,157 45,174
State Receipts Expenditures Bal of Pmts
Virginia 86,367 183,282 96,914
Maryland 63,520 111,456 47,937
Kentucky 31,983 77,157 45,174
Balance of Payments -
Est Distribution of Federal Receipts/Expenditures by State, FFY 2018 (Millions)
Govt should be about Fairness.
https://rockinst.org/wp-content/uploads/2020/01/1-22-20-Balance-of-Payments.pdf
Est Distribution of Federal Receipts/Expenditures by State, FFY 2018 (Millions)
Govt should be about Fairness.
https://rockinst.org/wp-content/uploads/2020/01/1-22-20-Balance-of-Payments.pdf
Andrew Cuomo fact-checks Mitch McConnell: Kentucky gets more federal help than blue states
"Kentucky takes out $138 billion more than they put in,” he said. "Your state is getting bailed out — not my state" https://www.salon.com/2020/04/24/andrew-cuomo-fact-checks-mitch-mcconnell-kentucky-gets-more-federal-help-than-blue-states/
"Kentucky takes out $138 billion more than they put in,” he said. "Your state is getting bailed out — not my state" https://www.salon.com/2020/04/24/andrew-cuomo-fact-checks-mitch-mcconnell-kentucky-gets-more-federal-help-than-blue-states/
For the four federal fiscal years that ended Sept. 30, 2018, the most recent numbers available, Kentucky got $148 billion more from the federal government than the Bluegrass State sent to Washington. https://www.washingtonpost.com/business/2020/04/27/mitch-mcconnells-kentucky-has-been-getting-federal-bailout-money-years-thats-reality/
Kentucky consistently relied more on federal funds than the 50-state average, with the biggest increases seen during the federal stimulus spending that followed the 2008 recession and the state’s decision to expand Medicaid coverage. The govt covered that.
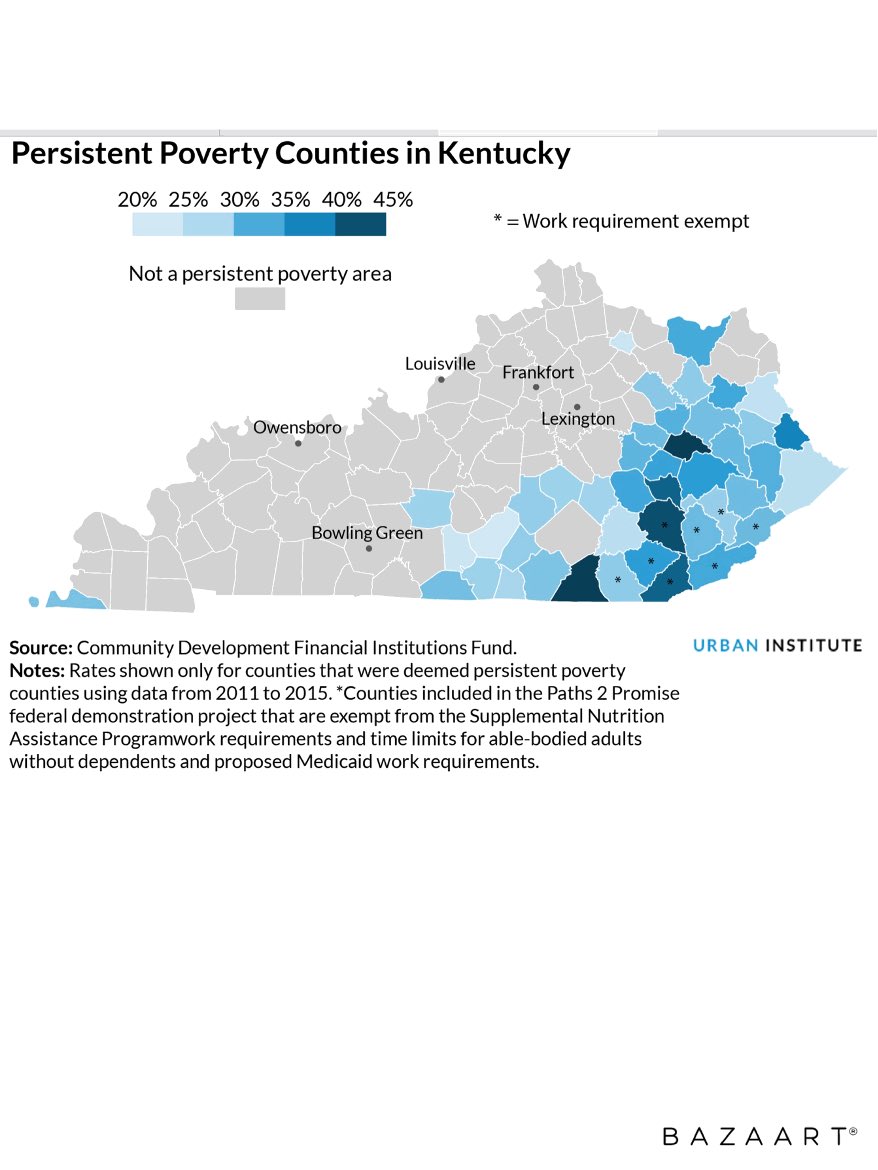
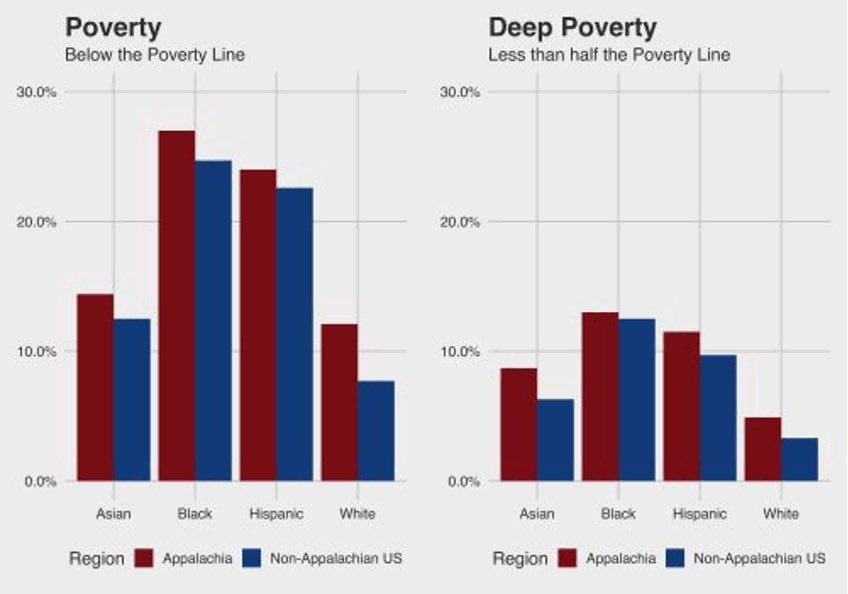
Kentucky is one of the poorest states. According to the Census Bureau, 18.9% of Kentucky’s population lived in poverty in 2015, compared to a national poverty rate of 13.5%. With all the federal money, why are so many still in poverty.
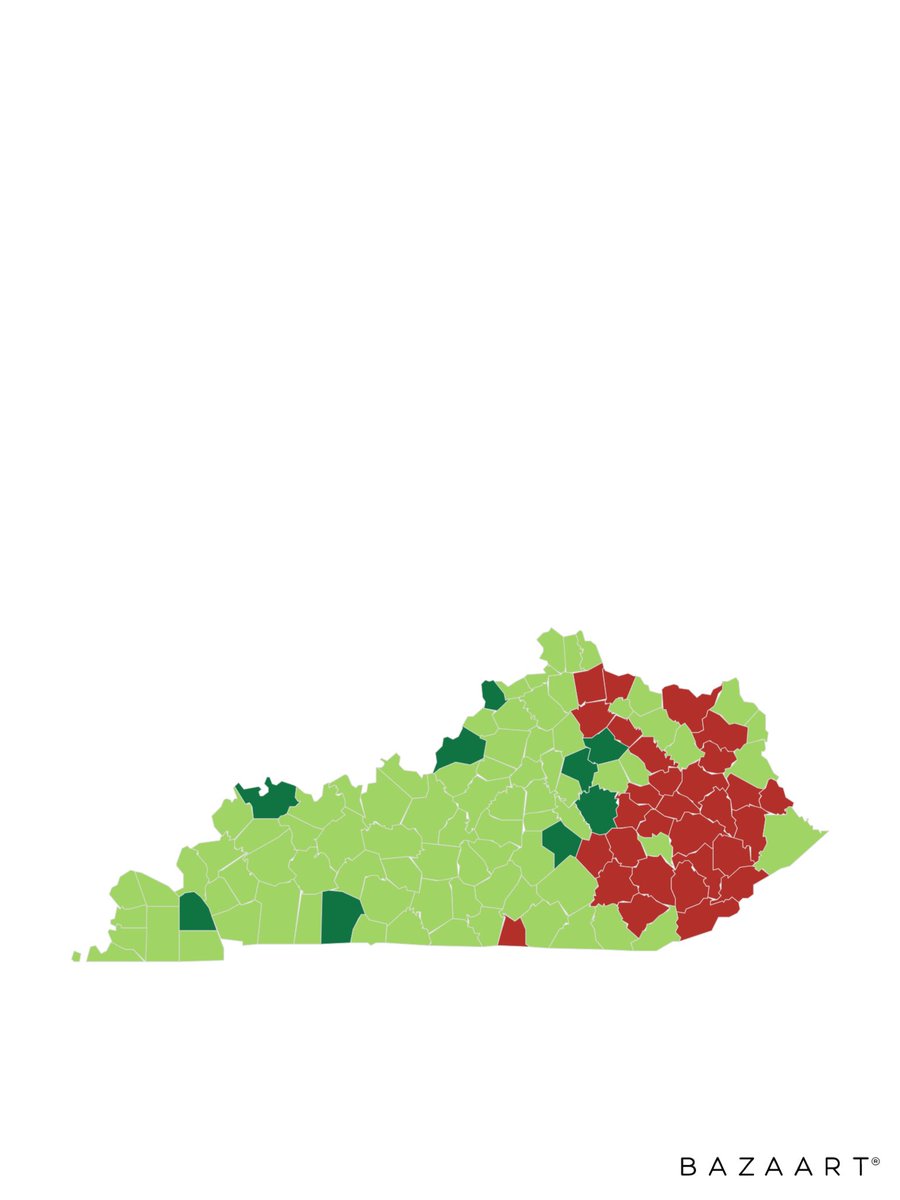
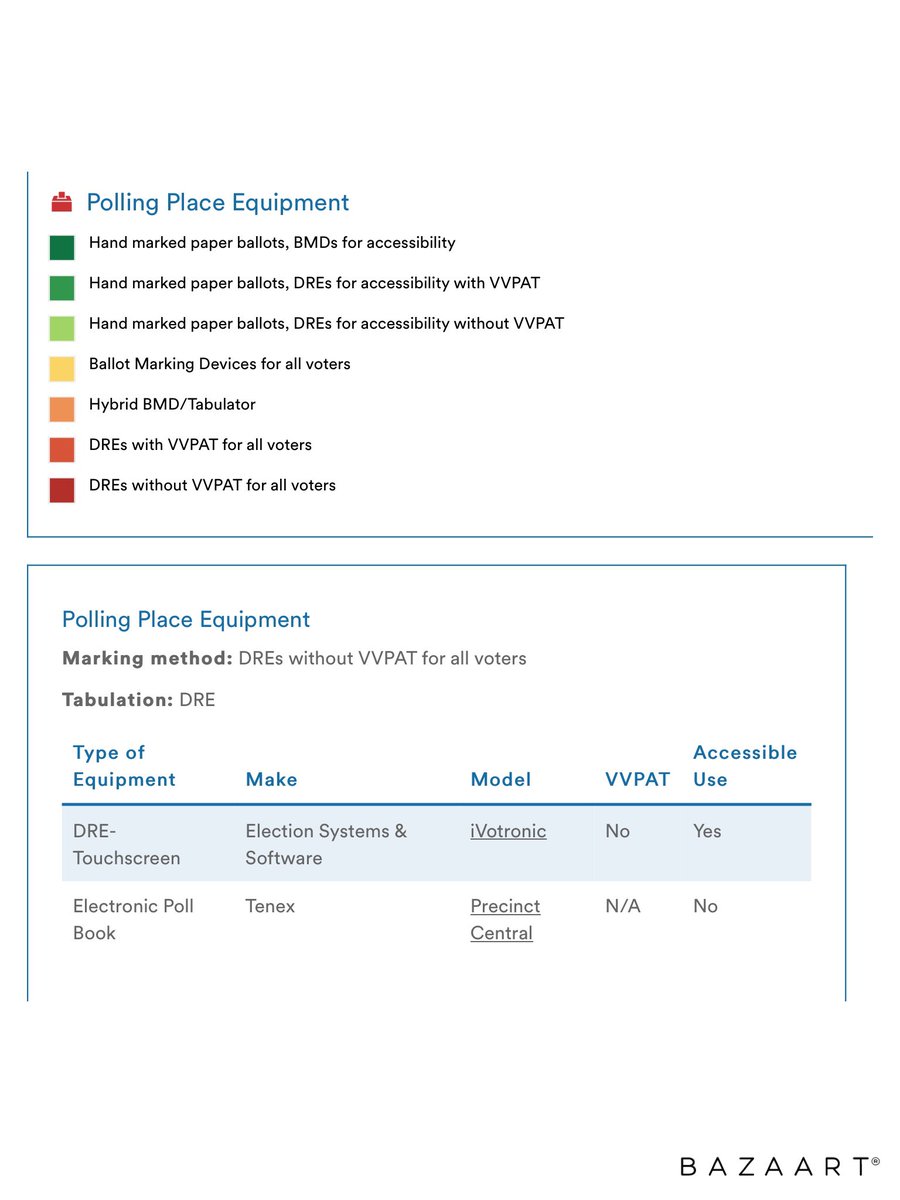
DRE voting machines without paper in poorest part of the state - eastern - which is roughest terrain.
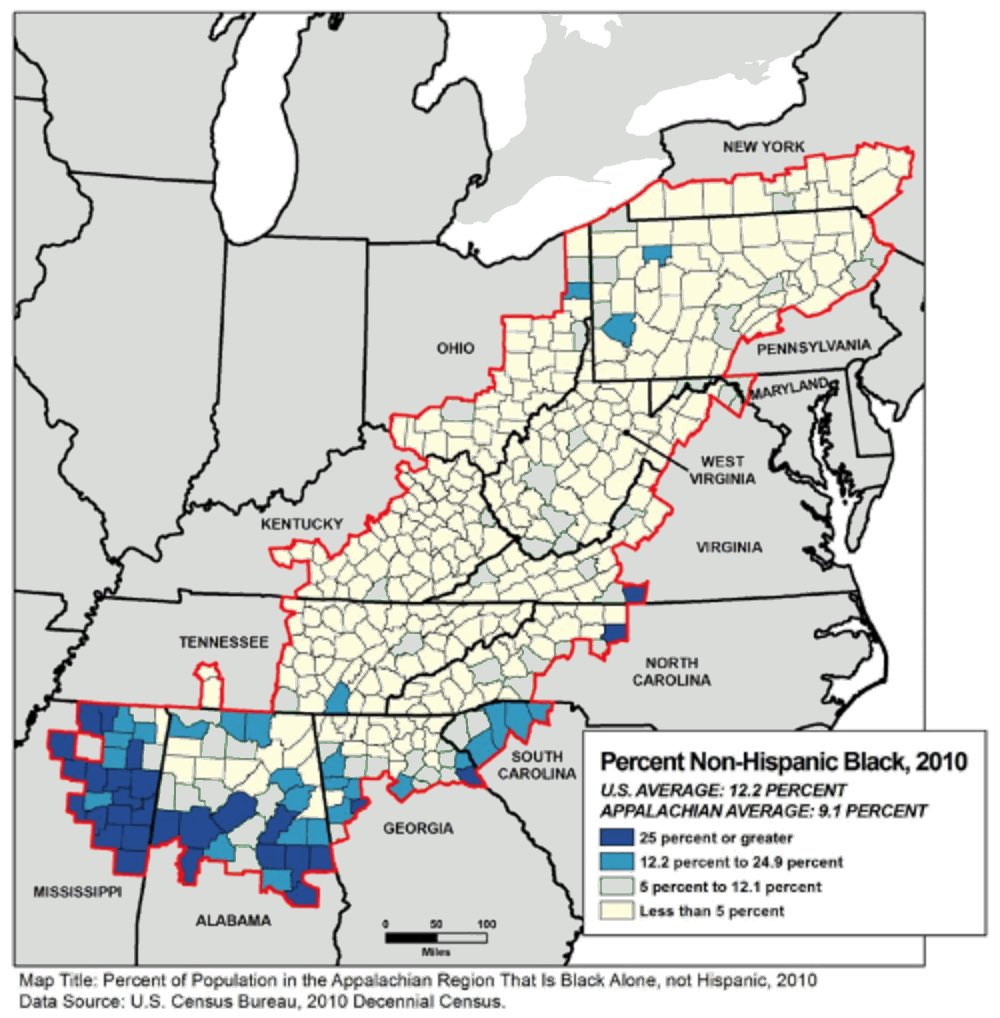
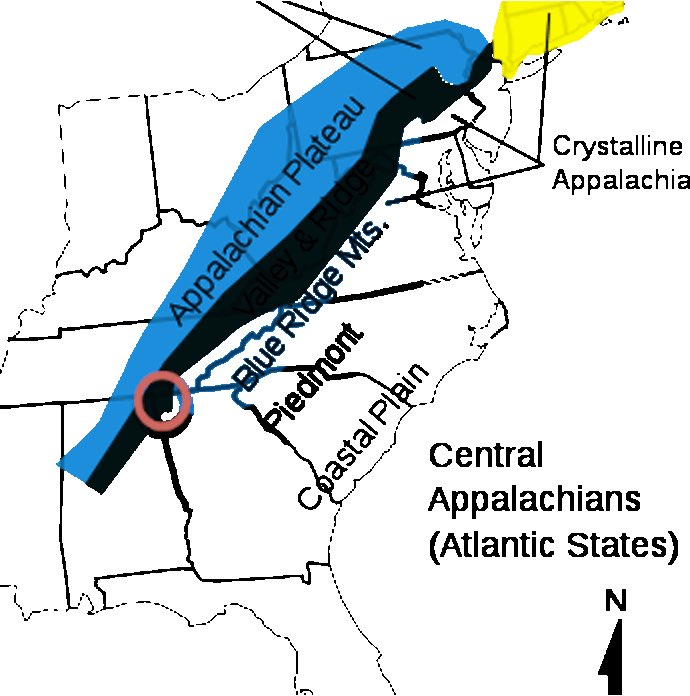
slavery existed in “every county in Appalachia in 1860.”
data from county tax lists, census manuscripts, records from slaveholders, and slave narratives from the area—est that 18% of Appalachian households owned slaves, compared to approx 29% of Southern families, in general.
data from county tax lists, census manuscripts, records from slaveholders, and slave narratives from the area—est that 18% of Appalachian households owned slaves, compared to approx 29% of Southern families, in general.
While enslaved people in Appalachia were less likely to work on large plantations, their experiences were no less harsh. They often tended small farms and livestock, worked in manufacturing and commerce, served tourists, and labored in mining industries.
https://thesocietypages.org/socimages/2019/02/20/hidden-black-history-in-appalachia/
https://thesocietypages.org/socimages/2019/02/20/hidden-black-history-in-appalachia/
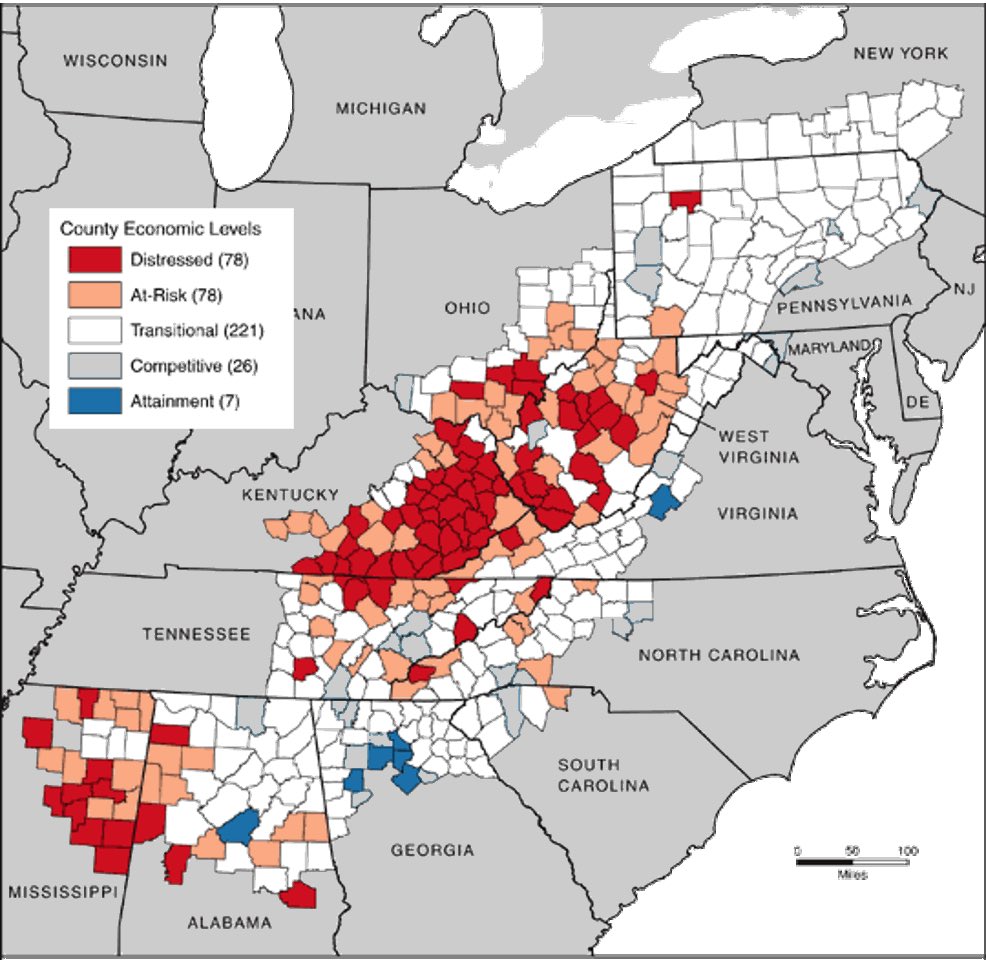
APPALACHIAN REGIONAL DEVELOPMENT ACT, 1965 -
Congress finds & declares the Appalachian region, while abundant in natural resources & rich in potential, lags behind the rest of the Nation in its economic growth & that its people have not shared properly in the Nation’s prosperity.
Congress finds & declares the Appalachian region, while abundant in natural resources & rich in potential, lags behind the rest of the Nation in its economic growth & that its people have not shared properly in the Nation’s prosperity.
Since 1965, the Appalachian Regional Commission (ARC) has invested $4.5 billion in approximately 28,000 economic development projects across Appalachia, attracting over $10 billion in matching project funds.
ARC’s mission is to innovate, partner, and invest to build community capacity and strengthen economic growth in Appalachia to help the Region achieve socioeconomic parity with the nation.
fail.
fail.
"Kentucky Is Home to the Greatest Declines in Life Expectancy"
In eight counties in the state, people can expect to die younger than their parents. https://www.theatlantic.com/health/archive/2017/05/kentucky/525777/
In eight counties in the state, people can expect to die younger than their parents. https://www.theatlantic.com/health/archive/2017/05/kentucky/525777/
Key Findings from the 2017 Kentucky Minority Health Status Report - (excerpts)
1. Racial and ethnic minority groups are younger than their White counterparts.
2. Hispanics and Blacks have higher unemployment rates when compared to Whites.
1. Racial and ethnic minority groups are younger than their White counterparts.
2. Hispanics and Blacks have higher unemployment rates when compared to Whites.
3. Black and Hispanic residents are more likely to be renters in the state, while their White counterparts are more likely to own a home.
4. In fiscal year 2015, only 18.5% of Medicaid-enrolled women ages 40-64 received screening mammograms.
4. In fiscal year 2015, only 18.5% of Medicaid-enrolled women ages 40-64 received screening mammograms.
5. Hispanic women are less likely to receive a Pap test than White women, a downward trend from 2014.
6. Among those in 2016 with 14 or more mentally unhealthy days in the past month, Hispanics had the highest rate at 19.7%, with Blacks having the second highest rate at 16.2%.
6. Among those in 2016 with 14 or more mentally unhealthy days in the past month, Hispanics had the highest rate at 19.7%, with Blacks having the second highest rate at 16.2%.
7. Blacks have the highest rate of obesity when compared to Hispanics and Whites.
8. White high school adolescents in the state are much more likely to smoke cigarettes than their Black counterparts.
9. Black men have the shortest life expectancy of all groups.
8. White high school adolescents in the state are much more likely to smoke cigarettes than their Black counterparts.
9. Black men have the shortest life expectancy of all groups.
10. Black infants continue to be nearly twice as likely to die in the first year of life as White infants.
11. Blacks have a higher mortality rate for cerebrovascular disease than Whites.
12. Blacks have a higher cancer mortality rate for prostate, breast, colorectal cancer.
11. Blacks have a higher mortality rate for cerebrovascular disease than Whites.
12. Blacks have a higher cancer mortality rate for prostate, breast, colorectal cancer.
13. Age-adjusted mortality rate for diabetes is greater for Blacks than Whites.
14. The overall teen pregnancy rate remains above the national average, and Hispanics have the highest rate among racial and ethnic groups.
14. The overall teen pregnancy rate remains above the national average, and Hispanics have the highest rate among racial and ethnic groups.
15. White residents die of drug overdoses in Kentucky at the highest rate compared to other racial and ethnic groups.
Poor oral health can be a major risk factor for cardiovascular disease and stroke. In 2014 and 2016, more than 30% of Kentucky adults did not see a dentist.
Poor oral health can be a major risk factor for cardiovascular disease and stroke. In 2014 and 2016, more than 30% of Kentucky adults did not see a dentist.
64% of Americans 18-64 yrs & 62.7% of Americans 65 and older saw a dentist in the past year. Blacks visit the dentist or dental clinic at consistently lower rates than their Hispanic & White counterparts.
Kentucky had the highest rates of tobacco use at 26% vs. 15.1% nationally.
Kentucky had the highest rates of tobacco use at 26% vs. 15.1% nationally.
Tobacco use among disadvantaged populations is influenced by socioeconomic status, mental and behavioral health issues, toxic stress, predatory marketing, and the capacity of communities to mount effective tobacco control initiatives.
Social indicators such as housing, education, income, discrimination, racism, & stress, all contribute to premature death.
the root causes of poor health outcomes: the Built Environment, healthcare access, unemployment, education, poverty, & access to healthy, affordable foods.
the root causes of poor health outcomes: the Built Environment, healthcare access, unemployment, education, poverty, & access to healthy, affordable foods.
Built environment is defined as the human-made space in which people live, work, and recreate on a day-to-day basis.
Significantly higher cancer mortality rates for Black residents may be due to lower diagnostic screening rates, later diagnosis & disparities in cancer treatment.
Significantly higher cancer mortality rates for Black residents may be due to lower diagnostic screening rates, later diagnosis & disparities in cancer treatment.
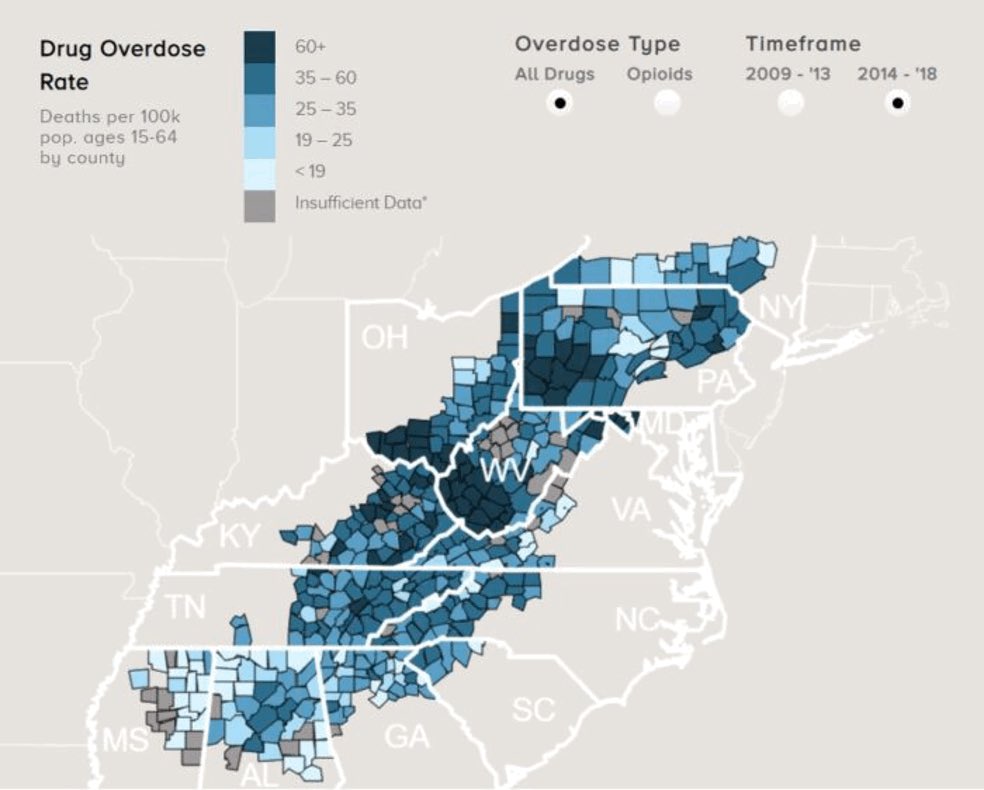
In Kentucky, long-term geographically concentrated poverty, and the associated toxic stress has created vulnerability resulting in the Appalachian region of the state being disproportionately impacted by the opioid epidemic.
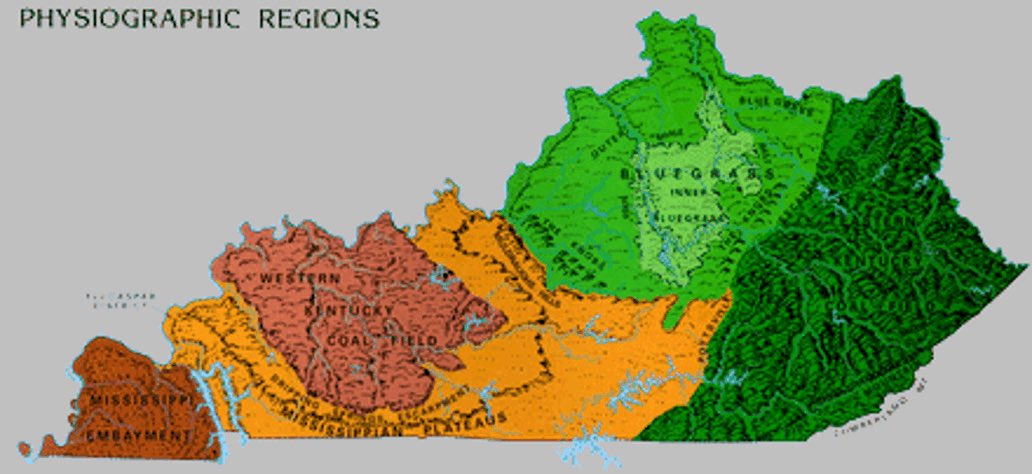
Physiographic regions show rough terrain of eastern Kentucky that has the highest poverty rate, poor health, lack of opportunity, worst voting machines all leading to a disadvantaged population.

 Read on Twitter