Tweet storm about #AZ #Election2020  - some hidden details I haven’t seen elsewhere:
Outstanding ballots by county can be viewed by status on the AZ SoS website, but there seem to be notable gaps that could make a big difference. /1
 - some hidden details I haven’t seen elsewhere:
Outstanding ballots by county can be viewed by status on the AZ SoS website, but there seem to be notable gaps that could make a big difference. /1
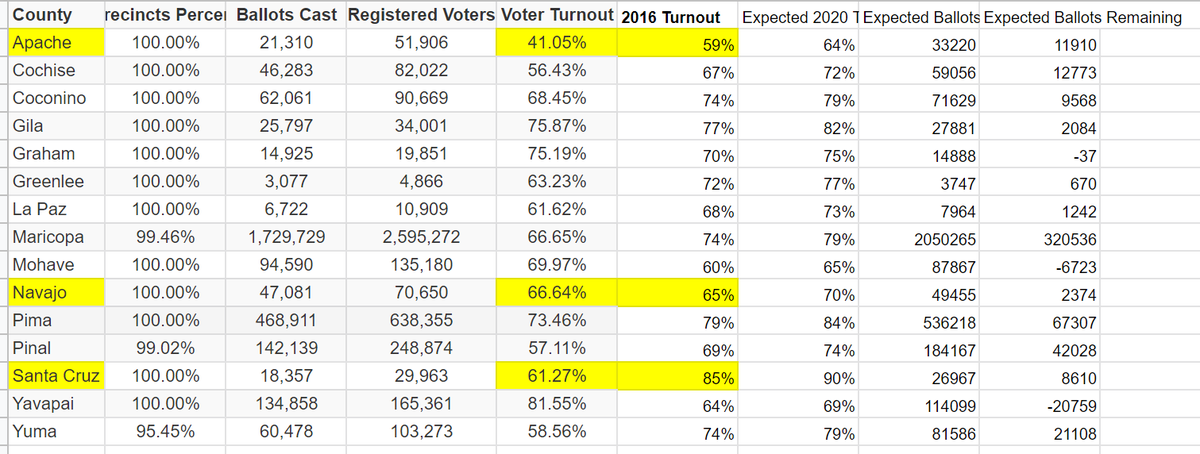
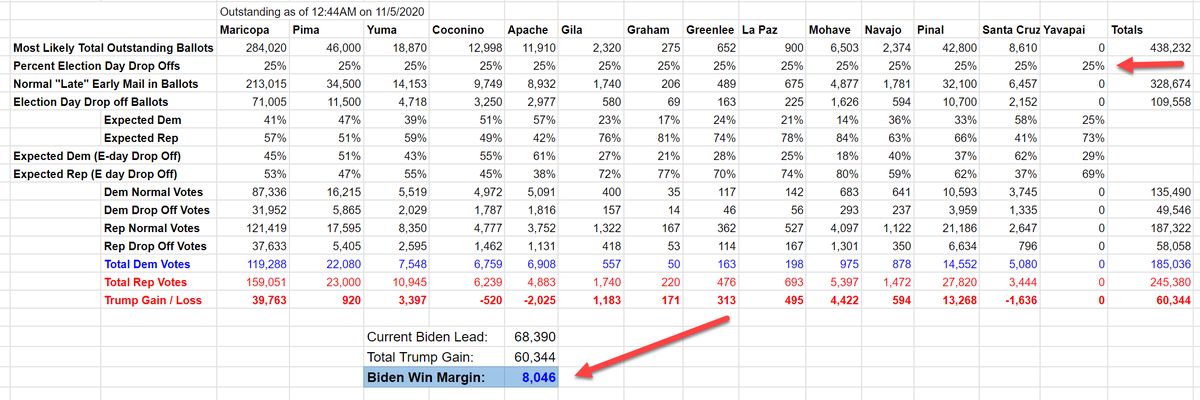
My assumption was that there’d be a 5% increase in turnout statewide. That seems to match what we’re seeing. When I compare that projected amount, to what is reported as outstanding on AZ SoS - there are some notable gaps. /2
Particularly in Apache, Navajo, and Santa Cruz counties.
I’m very confident that Apache and Santa Cruz ballots will come. There’d just be too big of a drop in turn out between 2016 and 2020 for the currently reported numbers to be all the ballots. /3
I’m very confident that Apache and Santa Cruz ballots will come. There’d just be too big of a drop in turn out between 2016 and 2020 for the currently reported numbers to be all the ballots. /3
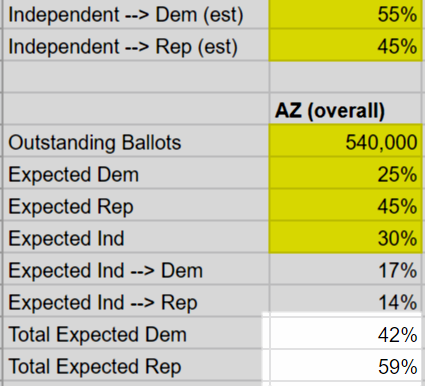
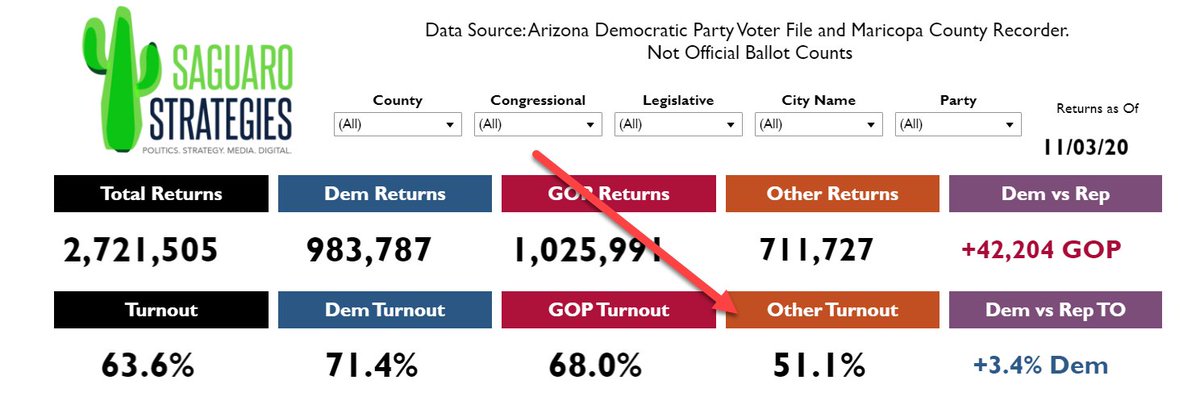
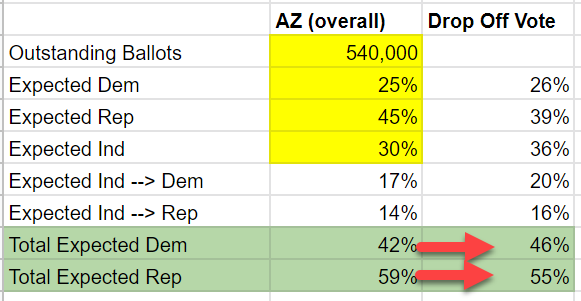
To estimate the ratio of Trump/Biden votes for mail in ballots. I’ve used two methods. The first method was just to assume that the ratio of Dem\\Rep\\Ind from 10/30-10/31 would hold about the same as the rest of the “late early mail in ballots”. That ratio is D:25% R:35% I:30% /4
Then, I allocated the IND vote to Biden and Trump. The most recent high-quality poll of AZ (NYT Sienna) said that split should be about 60/40 Biden. Polls have overestimated Biden a bit, so I made the assumption that the split would actually be 55/45 favoring Biden. /5
So, when I do that math, it means that of the 30% of the vote that is Independent about 17% go to Biden, and 14% go to Trump. Based on that, I calculated the statewide “late mail in ballots” should go 42% Biden and 59% Trump. /6
Then, I compared those assumptions to the ratios that were actually coming in. And they match very closely - within about a half a percent, but with the exact same spread: 41-58. /7
Honestly, the spread is what is important. What a 7% spread means, is for every 10,000 votes that are counted, 700 narrow the margin (in Trumps favor). 8% would mean 800, etc. /8
So, then, I took the ratios from those live county results and compared them to the overall county numbers. What I found was that when you compare the overall county data to the new data coming from he “late early mail ins” you get a 19% shift toward Trump. /9
So, if a count is at say 51%/47% Biden (like Maricopa) it’d shift to about 41%/57% Trump for the late mail ins. Similarly if the county overall is at 60/39 Biden (like Pima) it’d shift to 50/49 Biden with the mail ins. /10
So, I applied that math to every county statewide to come up with expected county-by county “late mail in” ratios. /11
Then, there’s a bit of quirk in AZ relative to Independents. As the early vote has come in, they’ve had a pretty low turnout relatively speaking. Credit: @SFAlmy /12
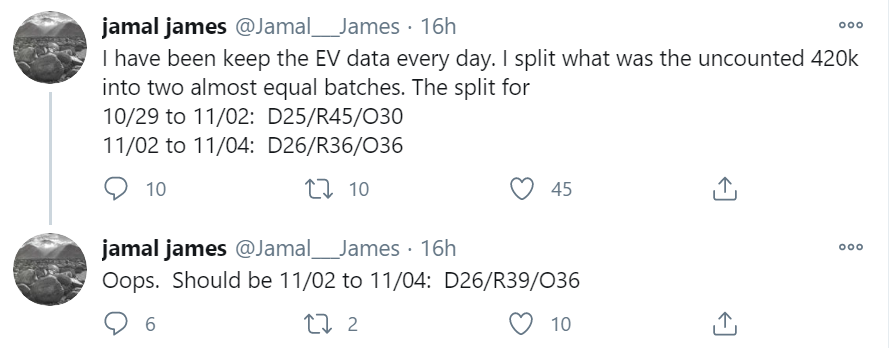
It turns out, that Independents are much more likely to drop off their mail in ballots at a polling place on Election day. Per @Jamal__James the ratio moves from 25% Dem / 45% Rep / 30% Ind → 26 DEM / 39 REP / 36 IND /13
According to @Garrett_Archer and others, those votes get counted last. This is pretty important: because, remember - those Independent voters are a much less Rep than *actual* Republicans - in fact, they lean DEM 55/45. /14
The net of that change means a shift of 8 points --> Biden. Ex: for every 10,000 “Late mail in” votes we’d expect Trump to close the overall gap by about 1700 votes. For E-day drop offs, those same we’d only expect the same 10,000 votes to close the gap by only 900 votes. /15
I applied that same 8% shift to all counties in AZ for some portion of their outstanding ballots. /16
Okay. So what percentage of the outstanding ballots are “Election day drop offs”? Idk. My estimate is 25% across the board. But, this is a pretty big area of uncertainty. /17
I’ll give you the link to the Google Sheet, and you can enter your own assumptions and it’ll auto calculate outcomes (spoiler alert - even like a 5% allocation leads to a Biden win). /18
And, here’s the link to the spreadsheet itself. Make a copy and enter your own assumptions about Percent election day drop-offs. /19 (End) https://docs.google.com/spreadsheets/d/1qod4RB3AERggXbtj-bH8jaigQtIInnVfsqpL6fPZqVs/edit#gid=1593692213

 Read on Twitter
