An update post lockdown. Unfortunately, we don't have Google mobility data post-Oct 30th (start date of the lockdown) yet, so let's look at how hospital data changed since then. Quick thread. https://twitter.com/jeuasommenulle/status/1320682084973858816
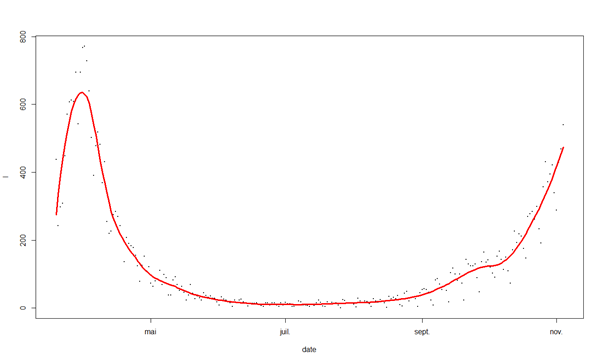
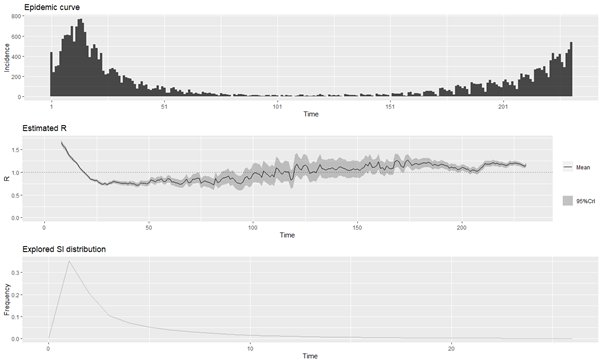
From worse to better, let's start with ICU. Incidence and non-parametric fit.
I certainly can't see any change.
I certainly can't see any change.
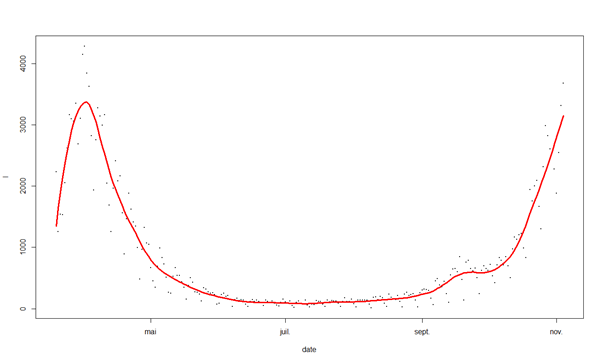
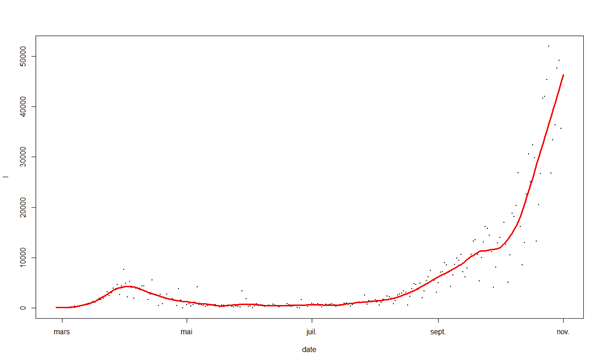
Now if you remember the original thread, I found that cases and ICU/Hospitals were lagged vs. cases and also that any impact on mobility would need 8-14 days to show in hospital data. So we should see more effects of lockdown in cases. What do we have? This.
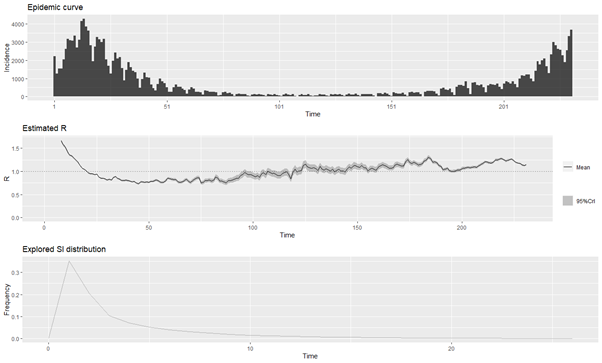
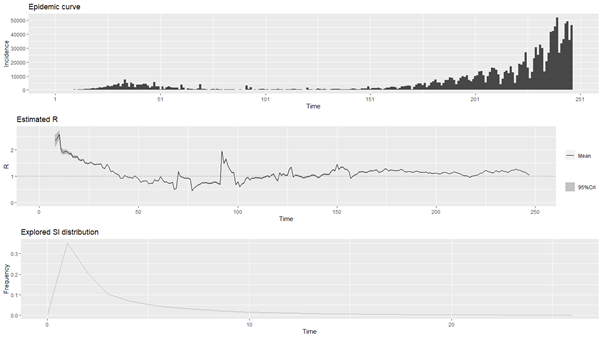
Ok, I realise it's not obvious, but the ugly exponential now looks slightly more like an ugly straight line. Not great, but is it better? R estimates for cases confirm it's better.
R is only slightly above 1 now.
BUT - and this is a BIG BUT (!) the drop in R is almost perfectly synchronized with school closures due to the school holidays.
So you have two ways of seeing this.
BUT - and this is a BIG BUT (!) the drop in R is almost perfectly synchronized with school closures due to the school holidays.
So you have two ways of seeing this.
1) the lockdown is working and we just need to wait a bit to see the impact on hospital data
2) the schools closing drove R down... reopening it during the lockdown means the whole thing will fail.
For now, I can't tell from the data which is right. Maybe Google data will help
2) the schools closing drove R down... reopening it during the lockdown means the whole thing will fail.
For now, I can't tell from the data which is right. Maybe Google data will help

 Read on Twitter