Results have slowed down again for the day -- PA and GA are trickling in, but for the most part I expect the biggest changes to resume again tomorrow. So I figured I’d share some insight into how Alameda thought about and handled this wild election (which isn’t even over).
First, the leadup. I wrote some about that already here: https://twitter.com/AlamedaTrabucco/status/1316060441517285376?s=20 -- in particular, the main question in the leadup was always one of polling error volatility.
How much should we update based on 2016’s famously inaccurate polling? 538’s model (giving Trump 10%) always seemed to be under-updating on that volatility -- they claimed (and claim :P) otherwise, but our sense was that they were getting the tails of the distribution wrong.
The markets represented another point of view -- in the weeks leading to the election, most prediction markets (on FTX and otherwise) were around 35% or so for Trump -- everyone agreed he was an underdog, and the market implied higher poll error volatility.
Again, Alameda’s sense was that 538 was under-updating -- both for the chance of big news in the weeks leading up (didn’t really happen), and also for extreme polling error which is hard to explain except by “something something polls involving Trump suck" (kinda happened).
How much is hard to say, of course, and the results of the election don’t actually prove what was right a priori -- they *suggest* that more volatility than 538 was running was better, but they prove nothing. Alameda was running something a good deal higher, for reference.
And what Alameda was running wasn’t constant, either -- it varied as different high-vol events passed, and decayed down a bit as it became clear there’d be no substantial October surprise. We also reacted to the markets, giving some weight to them when things moved.
(Which, BTW, is often correct regardless of whether you think the markets have information -- if I think they’re too high and will buy from me at any price, I’d might as well move my quotes up and let them buy even higher! This is called “maximizing.”)
So, that’s the lead-up to the election -- what about election day? The big thing that shifts on election day is that there’s a *ton* more information, and that information tends to be a lot *better*. What does that mean?
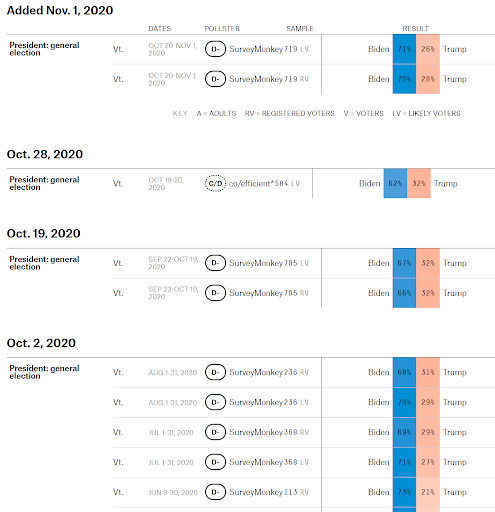
Well, let’s look at what data was available about Vermont’s vote before the election. Here’s all the polls 538 was aware of from the month leading up to the election in Vermont:
No one but Survey Monkey is doing literally any polls in Vermont! This makes sense, when you think about it -- Vermont is not a swing state, everyone knows it’s going blue, and no one is *really* financially incentivized to conduct good polls there -- even campaigns.
This was true for all but the swing states, and even swing states don’t have amazing (public) polls conducted. There are *better* ones, but it still remains the case that there’s just not a ton of money to be made making amazing polls -- so no one does (or maybe no one can!).
So the information pre-election ranges from trash to mediocre. But on election day, exit polls start coming out, giving some better information -- and then actual vote counts start coming out, which is obviously really useful information.
And it can be more useful than it seems, too. Sure, knowing that X% of a county’s or state’s votes went for Trump tells me something about that county or state -- but it turns out it can tell me something much more important, sometimes -- if I know how to listen.
Some sets of voters are correlated with each other -- this has been borne out before, and it makes good, intuitive sense to anyone who’s listened to the news. For instance, votes often fall along education, race, geographical, etc. lines in predictable, consistent ways.
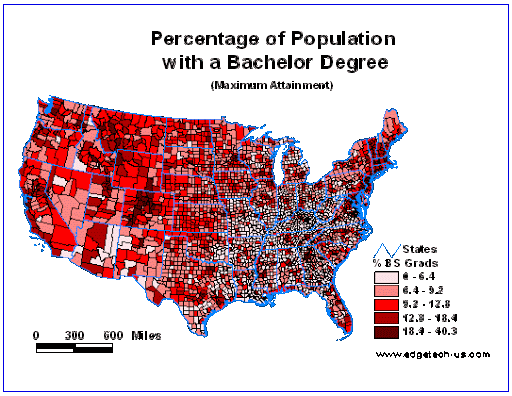
For instance, I didn’t check this, but I bet this map of the % of the population with a bachelor’s degree is pretty close to the same colors as whatever election map you’ve got up right now -- and that’s a pattern that basically always holds..
There’s a lot of axes along which we can learn that two sets of voters are similar or different, which we can use to construct predictions for unreported votes based on reported ones. And that can theoretically start whenever the first votes come in -- say, from Vermont.
It’s not clear the *best* way to do this, of course, and doing even a good job can often lead you over-fitting to data that will screw you. We built one that seemed pretty good, though, starting with priors and updating (hopefully!) smartly as more votes came in.
(Building a model like this also presents all kinds of data issues -- different states and counties report their results idiosyncratically, and doing a great job at ingesting it fast is both necessary and a giant pain in the ass.)
Every election is different, and this one was certainly no exception. One thing that made this one special was the huge number of early votes cast -- this made modeling a big challenge, and also proved to confuse the market during the day.
Everyone thought the early votes would skew heavily for Biden -- no one knew *exactly* how much, but, e.g., lots of states made party registration public before the election for early voters. What made this all hard, though, was that the timeline of vote reporting was not clear.
As it turned out, it basically went: many states released a batch of early votes first, then they released all their day-of votes and almost no early votes for a while, and finally released (or, in some cases, are releasing) the rest of the early votes.
This would all be fine, but if you don’t know it’s happening, you might see Trump doing *really* well compared to expectation -- for most of the day, no early votes were getting reported, and non-early votes skewed for Trump.
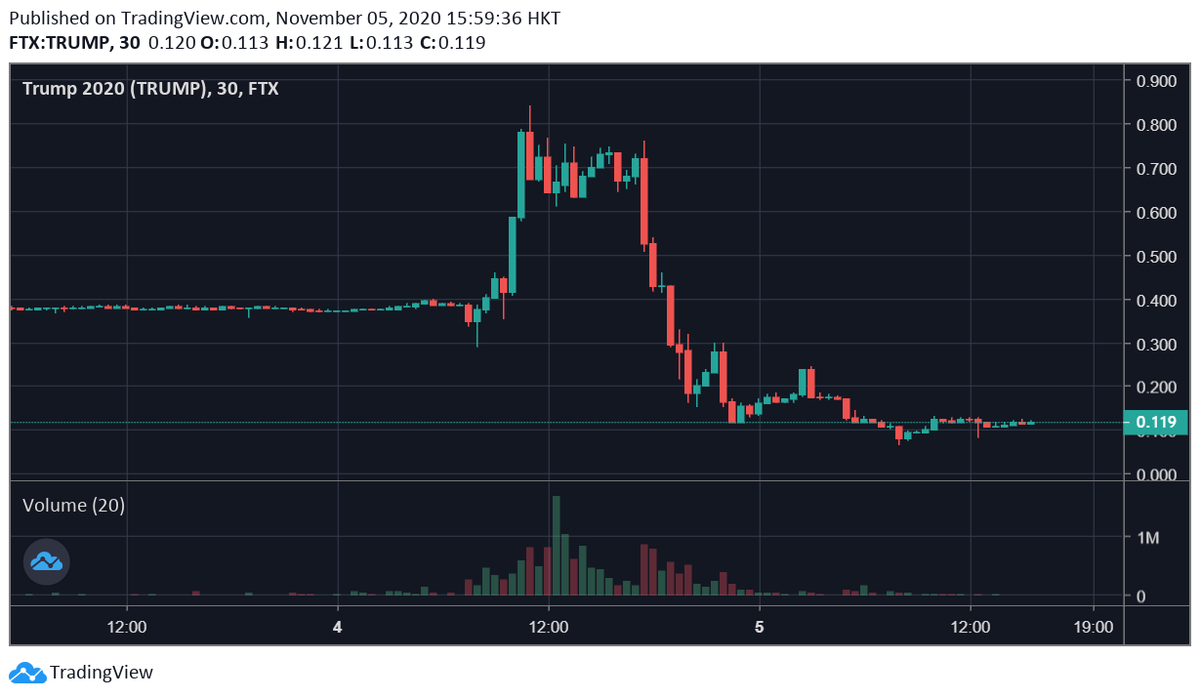
That seems to be just what the markets did -- TRUMP soared into the 80s on FTX amid great voting figures, and anyone not accounting for how many early votes had not been counted would have thought he was running away. Understanding this early would make selling *amazing*.
By the way, directly trading TRUMP and BIDEN weren’t the only options -- you can imagine that the U.S. markets care about the result, and so trading SPY could be good if you understood direction quickly enough. Similar for other products with fundamental TRUMP relationships.
(FWIW, many places didn’t release data on how many early votes were reported, and some even mislabeled them, so this was a *really* easy mistake to make -- it would have been basically impossible to make *zero* mistakes here, but having a plan and adapting helped a lot.)
The world realized this and TRUMP did sell off -- he fell quickly back down to 30 or so, and then slowly down to around 10 or 15 where he is now. As we stand, the rest of the game seems to be predicting PA, GA, NC, NV, and AZ.
For all those, there’s headway one can make by trying to sift through what kinds of votes are currently missing (along the same sorts of axes as I mentioned before) -- as well as if they’re early or day-of -- and try to guess their Trump % based on similarity to earlier votes.
It’s also important to try to understand *how many* votes are still missing, which sort of comes down to digging through government websites and statements and hoping they’re not misreporting (which they might be! Some were before).
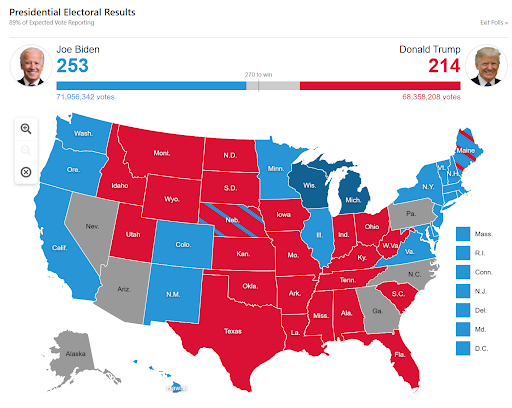
Doing these things can get you a guess for the probability Biden can make up his current deficit in PA or GA or whatever -- and combining all these can lead to a probability Biden gets to 270. And that’s basically it for modeling the election right now.
Moving forward, it’s important to be super vigilant tonight and tomorrow as more data comes in -- quickly analyzing whether new votes are good or bad for Trump (and be careful! If he gets 70% of a set of votes but was predicted to get 75%, this is *bad*) is critical.
Also critical is having models which can easily be adapted once you understand how to interpret the new data -- that lets you make the best trades the fastest, and often being fast is necessary to make money. (Being first to know Trump should be 50%, e.g., would be a huge boon.)
So that’s what I’m gonna get to trying to do! I honestly had a *ton* of fun modeling and trading this for the past two days -- a really fascinating trading environment, for a lot of reasons -- and I can’t wait to apply what I learned from this to other areas of trading!

 Read on Twitter


