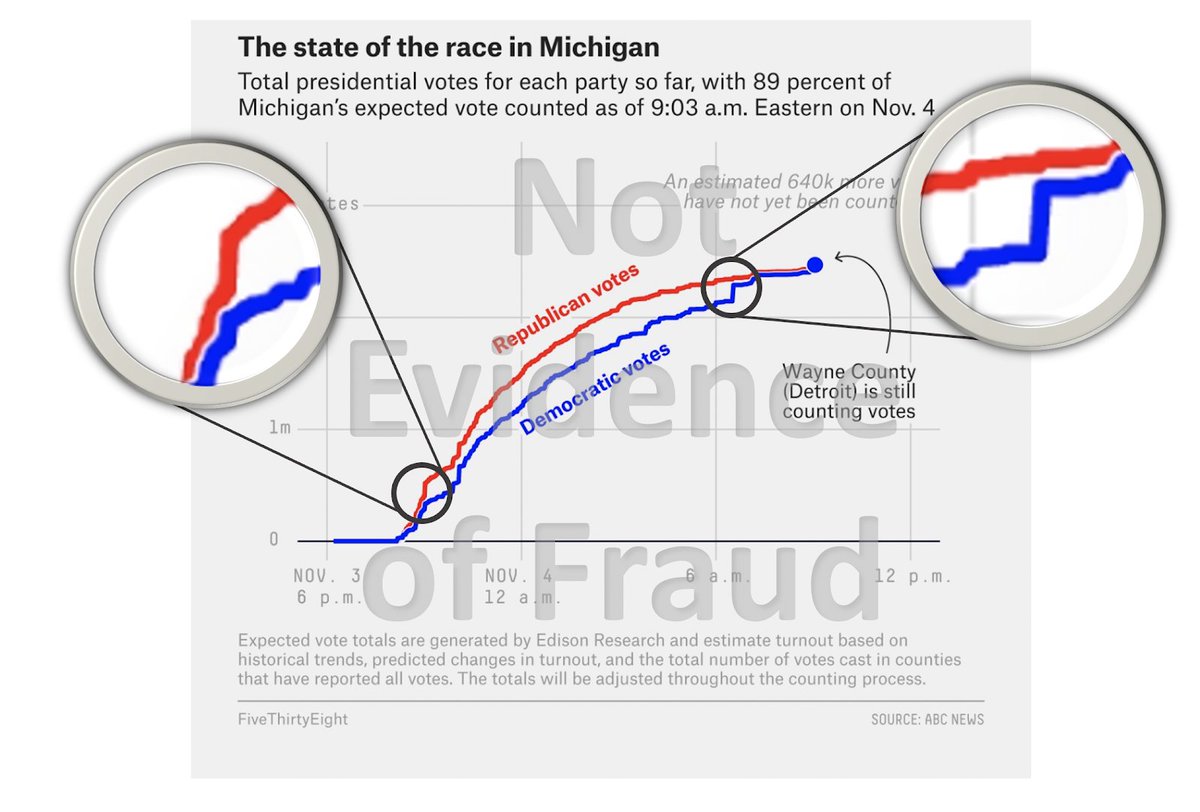
1/ Votes are still being counted. Mail-in ballots are often counted after in-person votes, and votes are sometimes reported in batches—which can “spike” counts. These “spikes” are normal and not evidence of fraud. 


2/ We are seeing misleading graphs online that mischaracterize these normal and expected spikes. For example, these graphs of Wisconsin & Michigan show a “spike” in Biden votes, decontextualized and reframed by a Twitter user to show “evidence” of massive fraud.
3/ A possible explanation for the size of the spikes is due to a) historically high voter turnout and b) an historic amount of mail-in ballots due to the pandemic. With more mail-in ballots and more people voting than in previous years, these jumps would be expected.
4/ Mail-in ballots are placed in “batches” for quick processing; these batches are then registered as official for each candidate. This is why one candidate can have a big jump without any notable change for the other. https://twitter.com/WI_Elections/status/1323986297481007104
5/ Enlarging the chart shows early spikes in Trump’s vote counts. This is likely due to Trump supporters voting in-person and those votes being reported first. This is typical in states that do both in-person and mail-in voting.
6/ Now that in-person votes are mostly reported, mail-in ballot counting and reporting is occuring. Democrats tend to use mail-in and absentee voting more than Republicans. This means that “spikes,” which reflect counted mail-in ballots, are expected to reflect Democrat votes.
7/ As ballots are still being counted across the US, we will likely see more “spikes” like this. This is not evidence of fraud. We will continue to monitor narratives around vote counting.

 Read on Twitter


