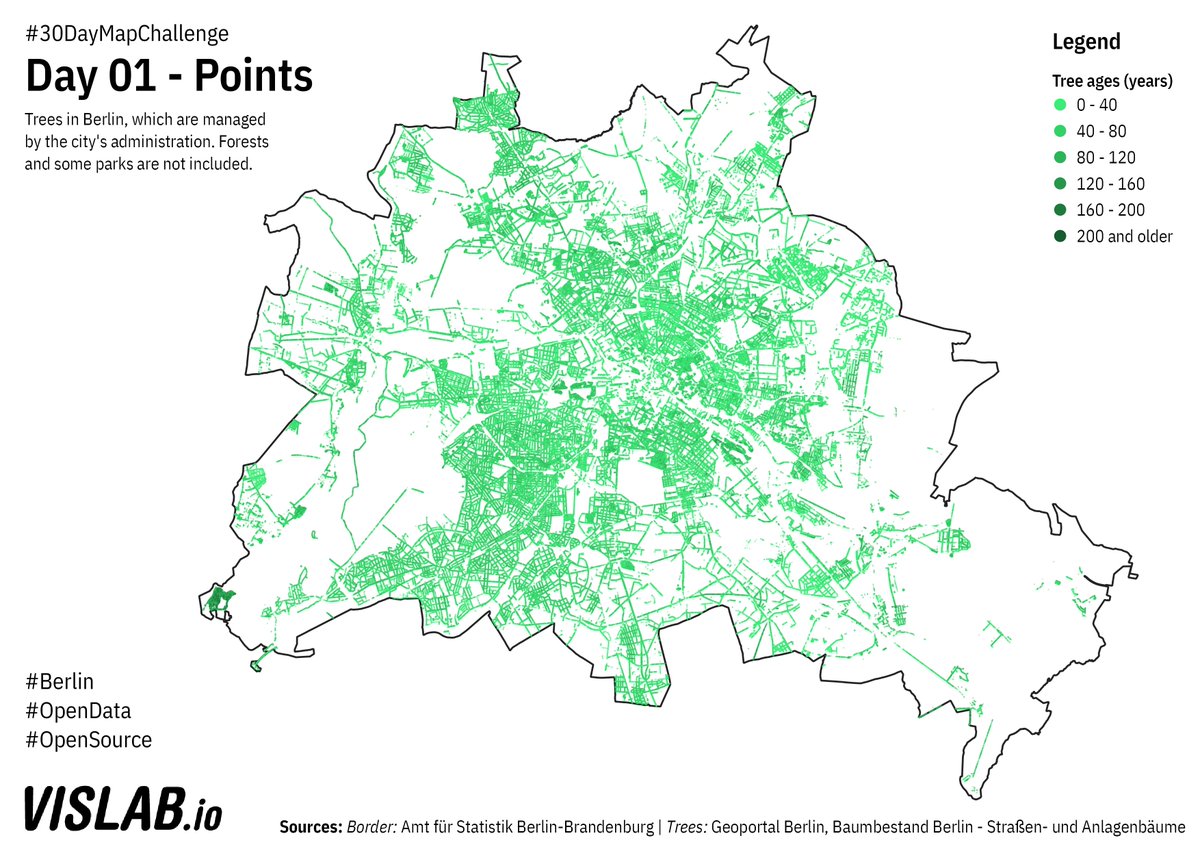
For this year's #30DayMapChallenge i will be trying to create 30 maps on #Berlin just using #OpenData and #OpenSource software. For day 01 - Polygons, a map of all of Berlin's street trees. #QGIS Source: https://github.com/sebastian-meier/ThirtyDayMapChallenge2020/tree/main/maps/01
BTW @citylabberlin has built an #FOSS platform for visualising and managing joint efforts for watering trees during dry periods in the summer: https://www.giessdenkiez.de Source code: https://github.com/technologiestiftung/giessdenkiez-de
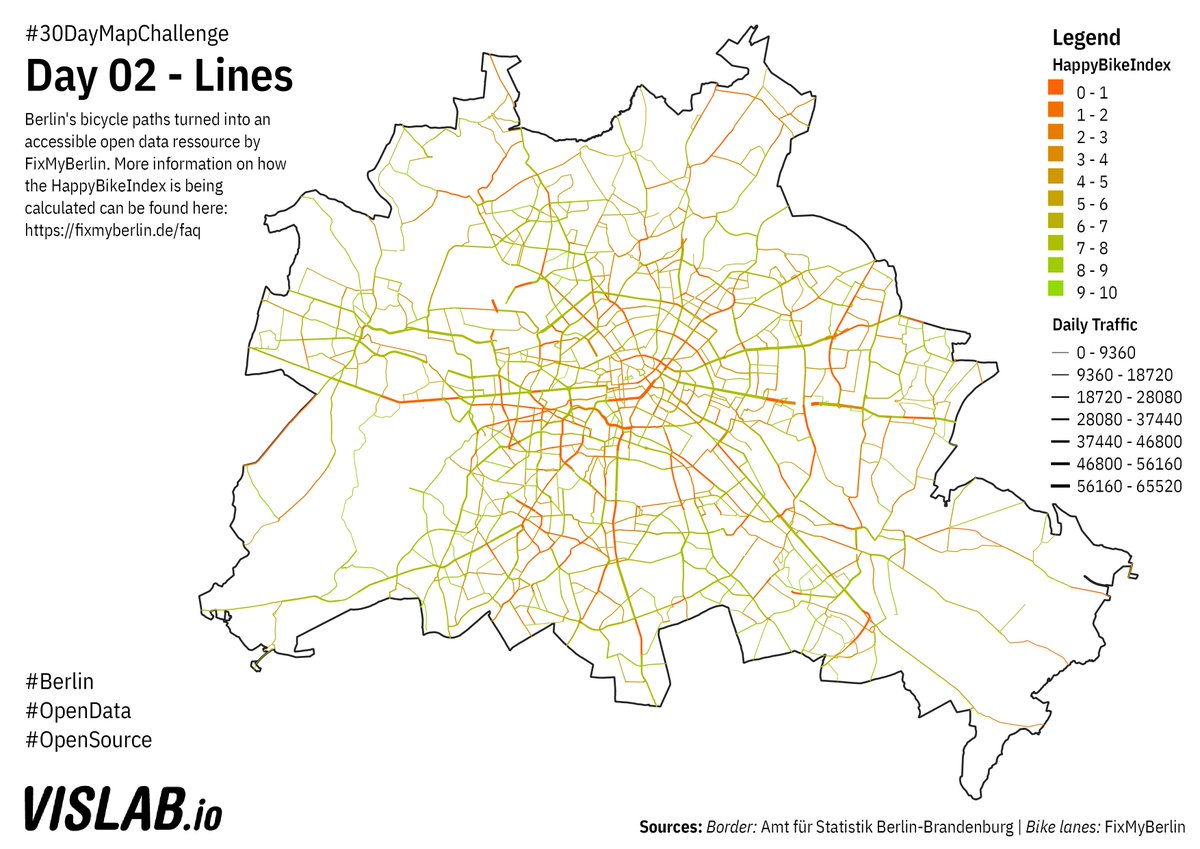
Day 2 of #30DayMapChallenge : Lines. Bike lanes in Berlin provided by @FixMyBerlin's API, showing their HappyBikeIndex. To explore the data set more in depth check out: https://fixmyberlin.de/zustand Code: https://github.com/sebastian-meier/ThirtyDayMapChallenge2020/tree/main/maps/02
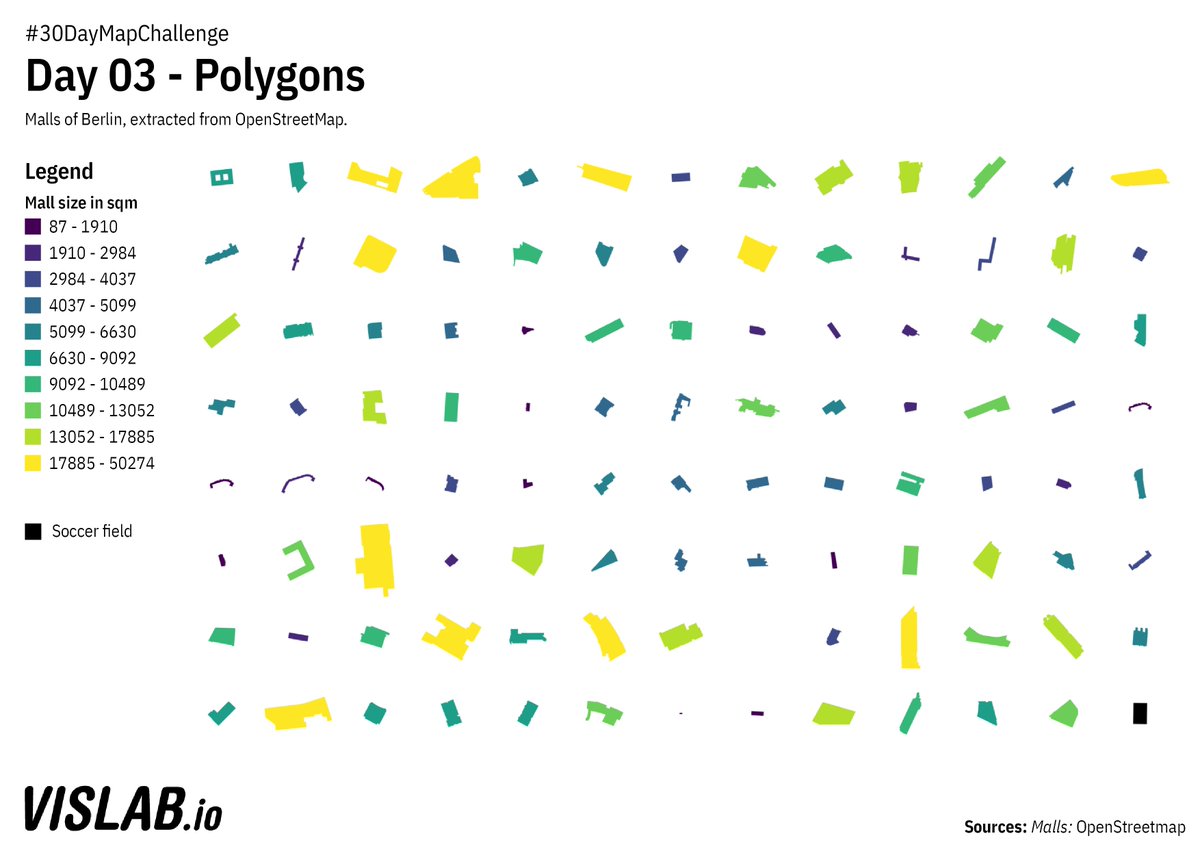
Day 3 of #30DayMapChallenge : Polygons. Shopping Malls of Berlin (and a soccer field for reference), exported from @openstreetmap Code: https://github.com/sebastian-meier/ThirtyDayMapChallenge2020/tree/main/maps/03
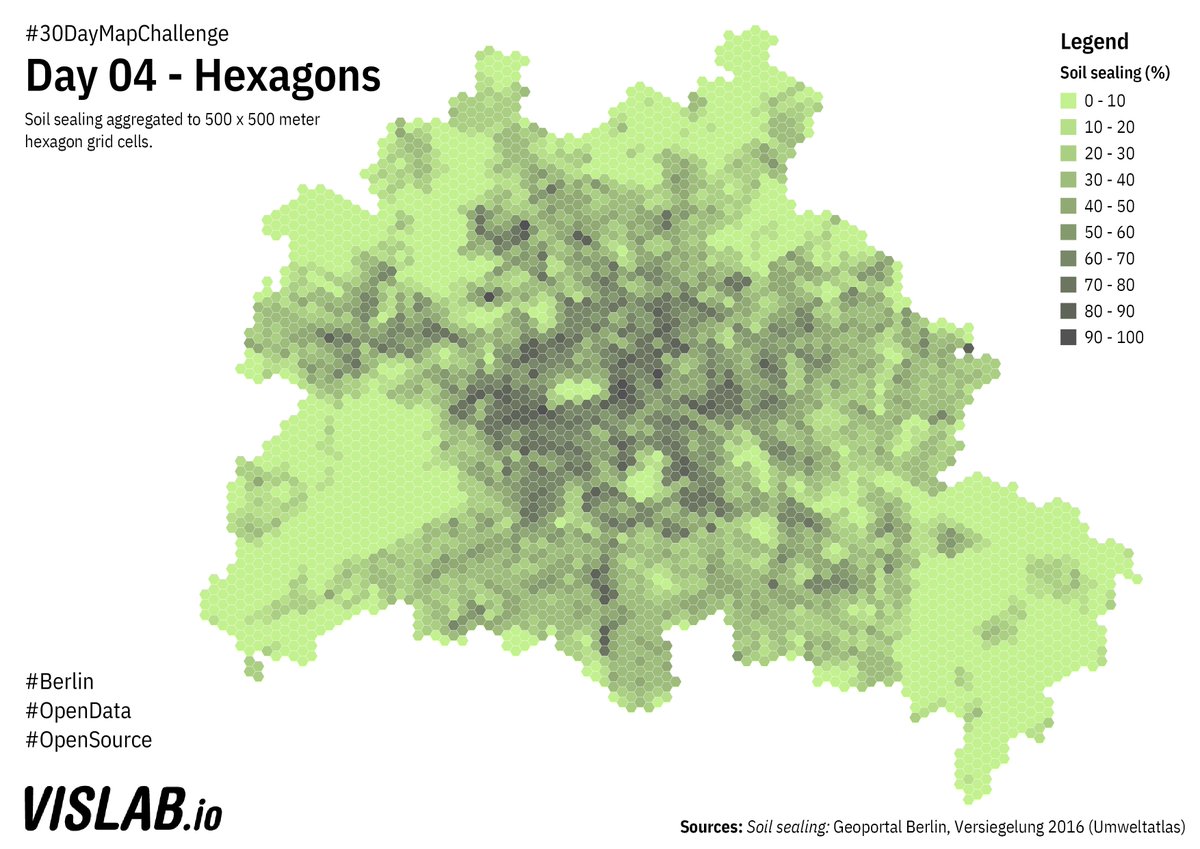
Day 4 of #30DayMapChallenge : Hexagons. The soil sealing of Berlin, aggregated to 500x500m hexagon grid cells in percentage. Besides @qgis also using @postgis today. Code: https://github.com/sebastian-meier/ThirtyDayMapChallenge2020/tree/main/maps/04
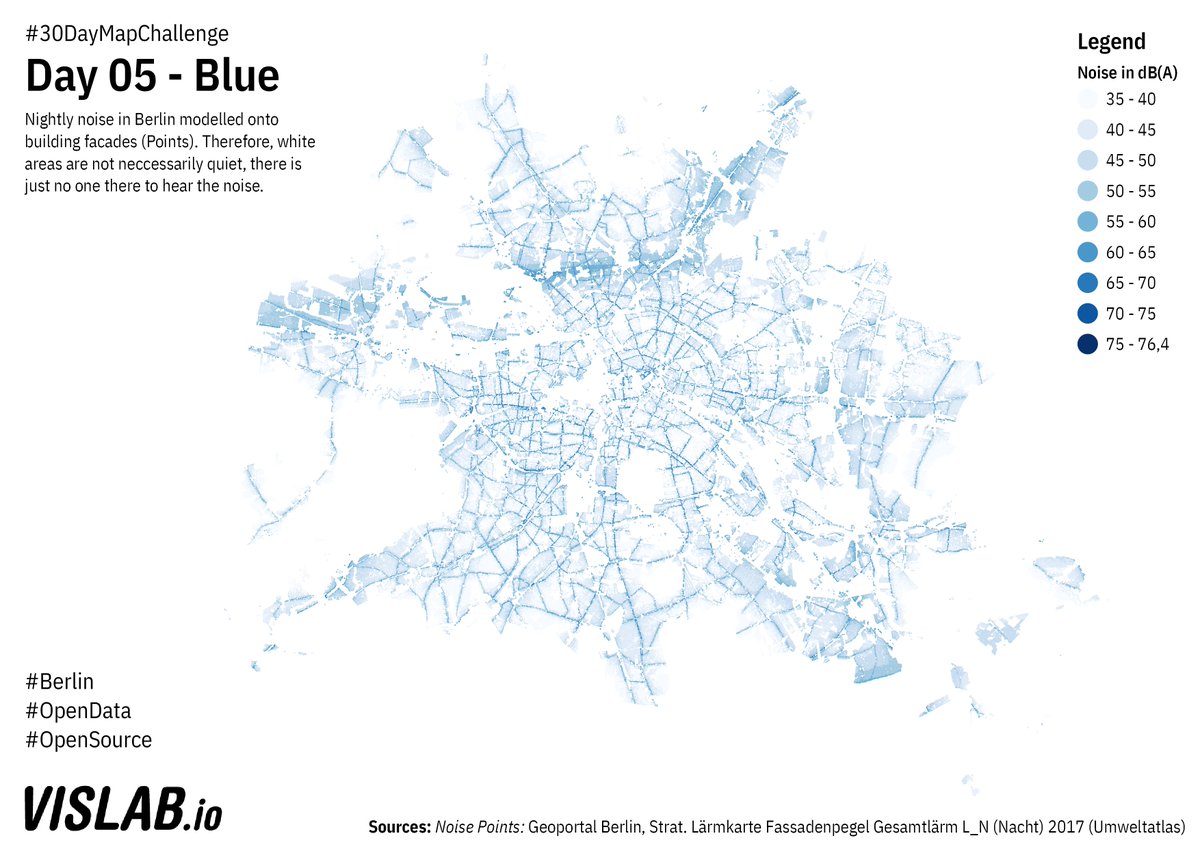
Day 5 of #30DayMapChallenge : Blue. Nightly noise levels in Berlin. The model projects noise onto residentialish buildings. White areas are not quiet, just no one living there to hear the noise. Some noisy areas in those white voids, like airports. Code https://github.com/sebastian-meier/ThirtyDayMapChallenge2020/tree/main/maps/05
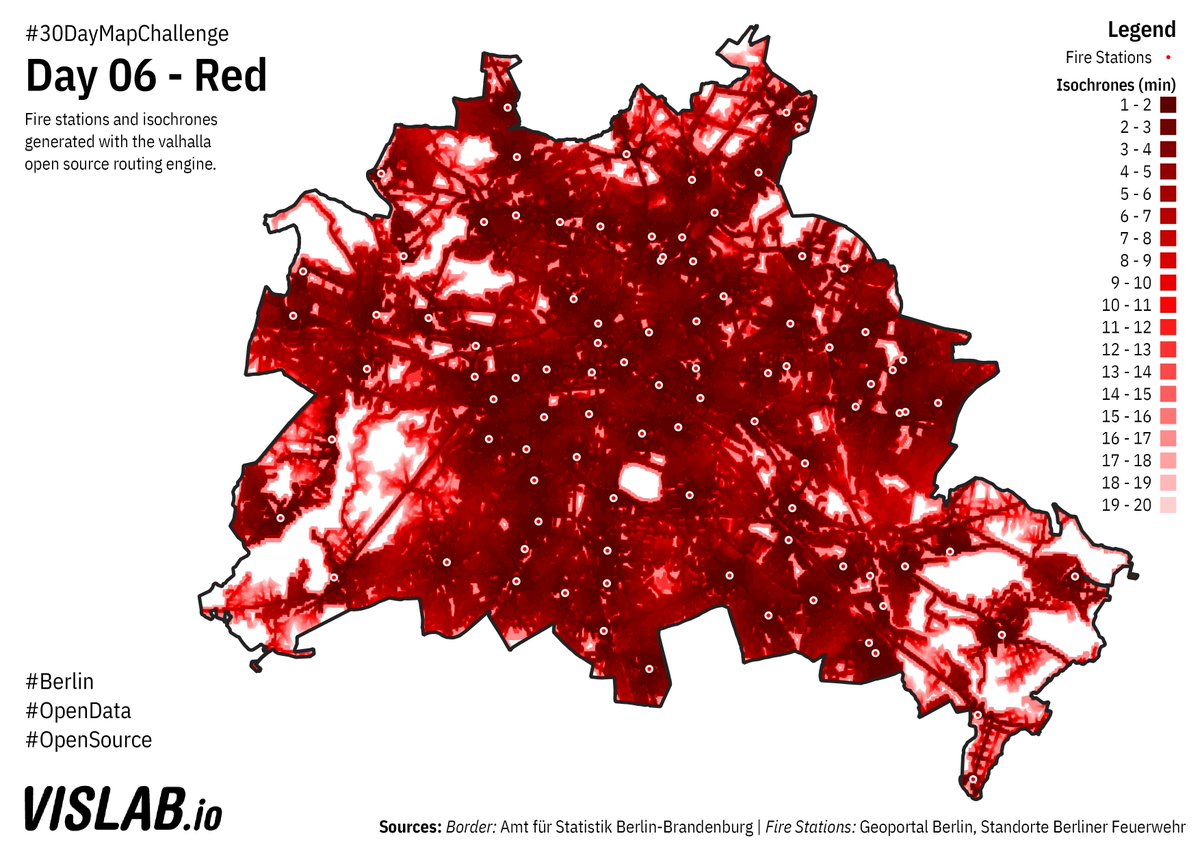
Day 6 of #30DayMapChallenge : Red. Fire stations with surrounding isochrones (estimated time of arrival). Thought this would look more interesting, but looks like @Berliner_Fw is nicely distributed


 . Isochrones done with @ValhallaRouting Code: https://github.com/sebastian-meier/ThirtyDayMapChallenge2020/tree/main/maps/06


 . Isochrones done with @ValhallaRouting Code: https://github.com/sebastian-meier/ThirtyDayMapChallenge2020/tree/main/maps/06
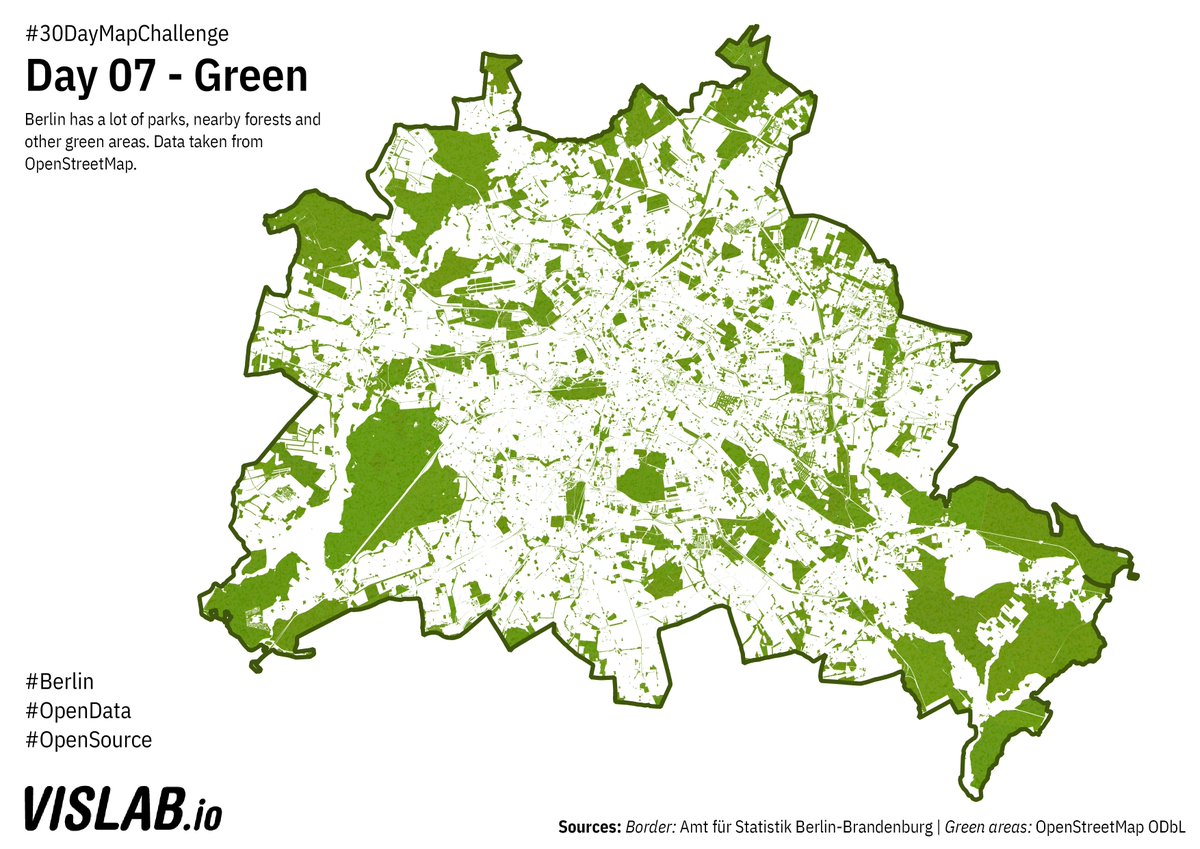
Day 7 of #30DayMapChallenge : Green. All the green bits of Berlin from forests to parks to allotments, Berlin has a lot to offer


 . Data from @openstreetmap Code: https://github.com/sebastian-meier/ThirtyDayMapChallenge2020/tree/main/maps/07


 . Data from @openstreetmap Code: https://github.com/sebastian-meier/ThirtyDayMapChallenge2020/tree/main/maps/07
Day 8 of #30DayMapCallenge : Yellow. Roof's suitability for photovoltaik solar energy systems. An interactive version can be found here: https://energieatlas.berlin.de/?permalink=izu5RSj Code: https://github.com/sebastian-meier/ThirtyDayMapChallenge2020/tree/main/maps/08
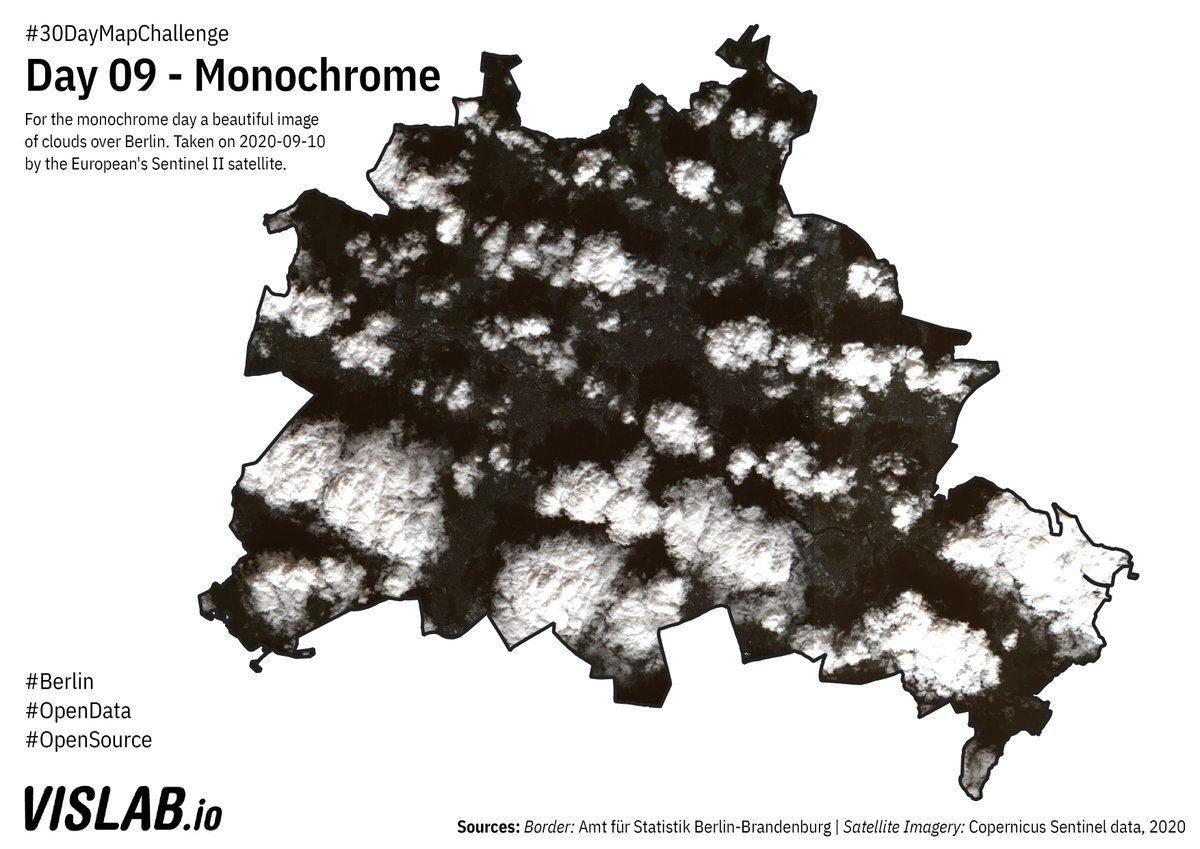
Day 9 of #30DayMapChallenge : Monochrome. A cloudy sentinel 2 photo from Berlin. @esa 's @CopernicusEU portal has tons of open data available. If you are new to satellite data, good tutorial by @FU_Berlin https://blogs.fu-berlin.de/reseda/ Code & Data links: https://github.com/sebastian-meier/ThirtyDayMapChallenge2020/tree/main/maps/09
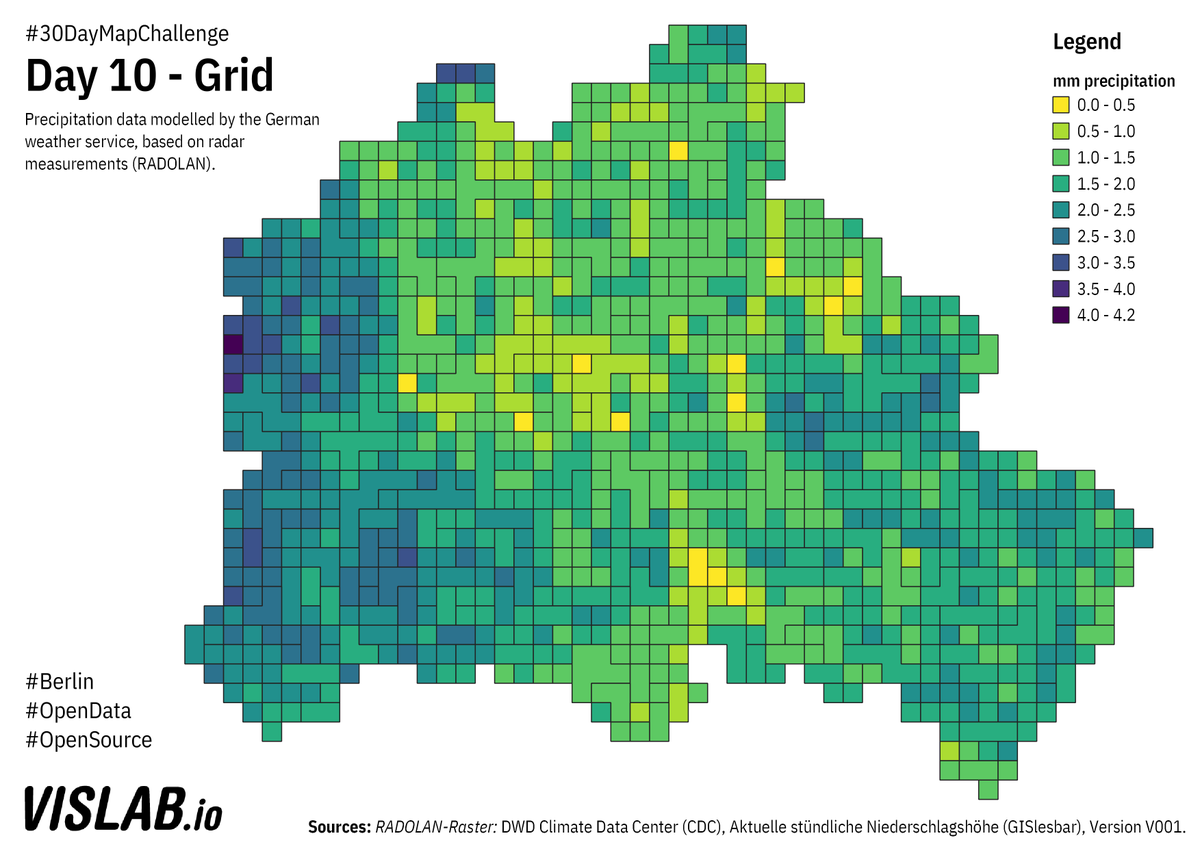
Day 10 of #30DayMapChallenge : Grid. Precipitation data from German Weather Service (DWD). The RADOLAN product provides modelled  from radar observations. This is hourly data for November 2nd 1:50AM. DWD has tons of open data https://opendata.dwd.de Code https://github.com/sebastian-meier/ThirtyDayMapChallenge2020/tree/main/maps/10
 from radar observations. This is hourly data for November 2nd 1:50AM. DWD has tons of open data https://opendata.dwd.de Code https://github.com/sebastian-meier/ThirtyDayMapChallenge2020/tree/main/maps/10

 Read on Twitter