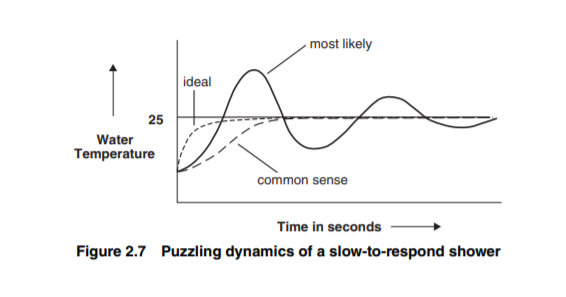
OK, so Tera my former BIS colleague put me onto this paper about Feedback loops. Because, believe it or not, the way a slow-to-respond shower behaves DOES tell us a bit about playing catch-up with COVID. Thread. 1/ https://twitter.com/TeraPauliina/status/1322301364421173248
So if you have a shower which only responds slowly, you keep turning the water too hot, responding too cold, and oscillating, basically. It is easy to make this happen in a spreadsheet - just insert some function that relates to things a few cells before... 2/
Now when Tera tweeted me this, I had already (following the inspiration of @ianmulheirn here https://twitter.com/ianmulheirn/status/1322863813658583042) built my own attempt to add to a COVID SIR model, where the R-rate responds to people being afraid of the deaths in the prior periods) 3/
And I noticed, obviously, that if you give people defined memories (i.e. they reduce R by an amount related to the log of deaths for the last X periods), you get cyclicality. Fear of death comes and goes. Human nature... 4/
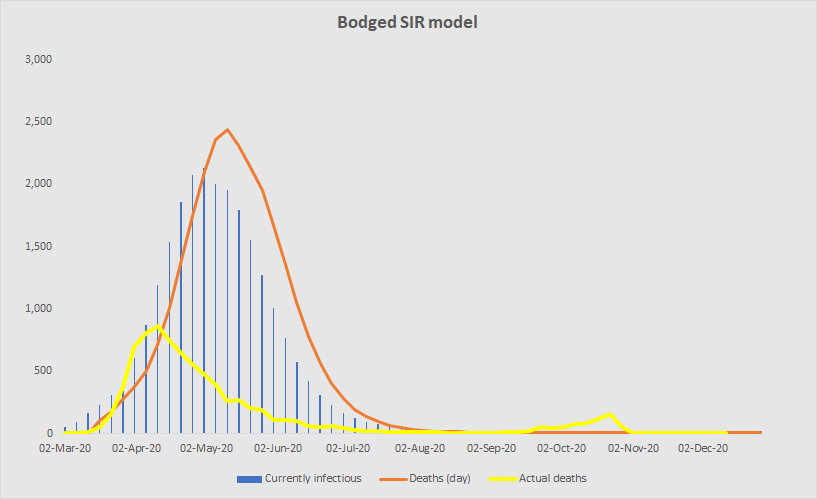
ANYWAY, I messed around to see what fear of death and death memory best fitted what actually happened this spring and summer. This is what I got. The yellow line is actual deaths (England) 5/
What does this prove? Nothing, except that you can reverse-engineer something like the return of Covid on the basis of people gradually forgetting to be scared of it.
But we know there are many more factors - like govt policy, reopening universities, etc .. 6/
But we know there are many more factors - like govt policy, reopening universities, etc .. 6/
(you could even say that policy makers have the same memory issues as the population they are trying to steer. All that "get back to the office" madness in Sep, huh?"). Anyway, what can I show with this? A couple of things 7/
One: if people were being scared and voluntarily shielding in spring, to get the R down, was their behaviour good? According to this model, yes: if they had been LESS scared, this is what I get - R too high, a rush to herd immunity, 3X the deaths: 8/
Then I added in a falling fatality ratio (to 0.20%) and asked what happens if we carry on like now. What I get is one more wave, and then it is over. But lots of weird assumptions (it is not a forecast!) 9/
Finally, very arbitrarily, it is POSSIBLE to get the lockdown-sceptics results with this model, if you put in extreme enough assumptions. This is one where you totally crush it in Autumn - but it comes back in January. Why? Because memories fade 10/
Conclusion: putting memory into a model gives it cyclicality. Every assumption is assumed, nothing is proven, it is just a model, I am not an epidemiologist, just a guy playing with a spreadsheet etc etc 11/11

 Read on Twitter


