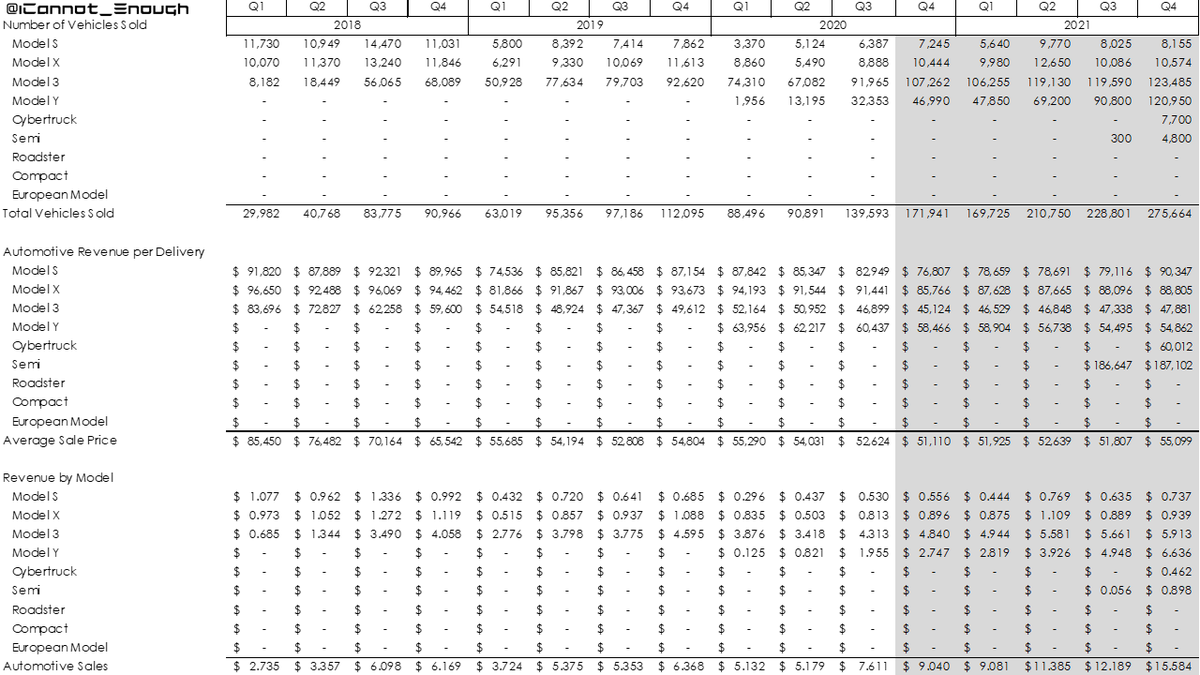
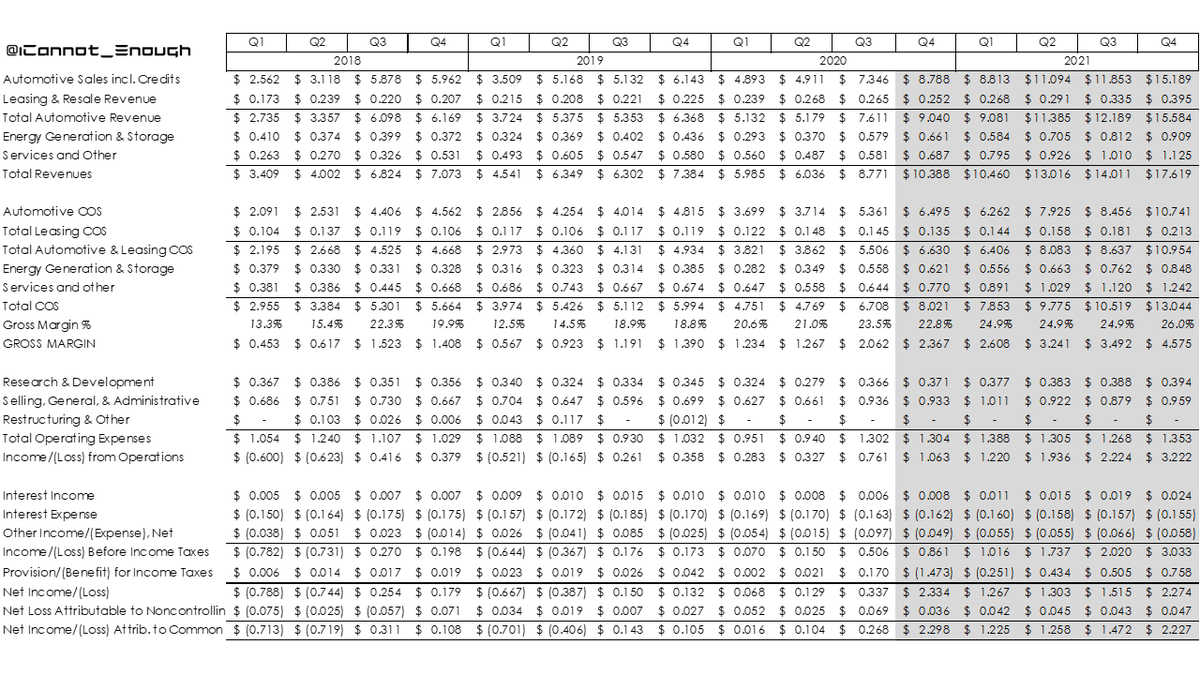
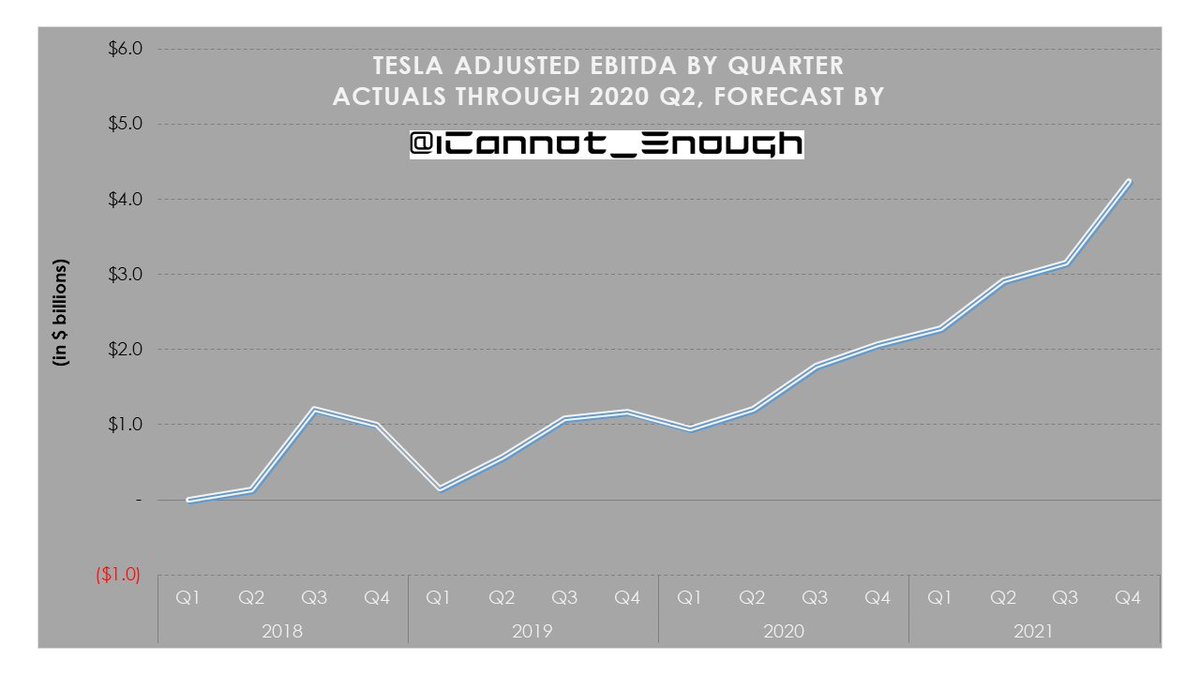
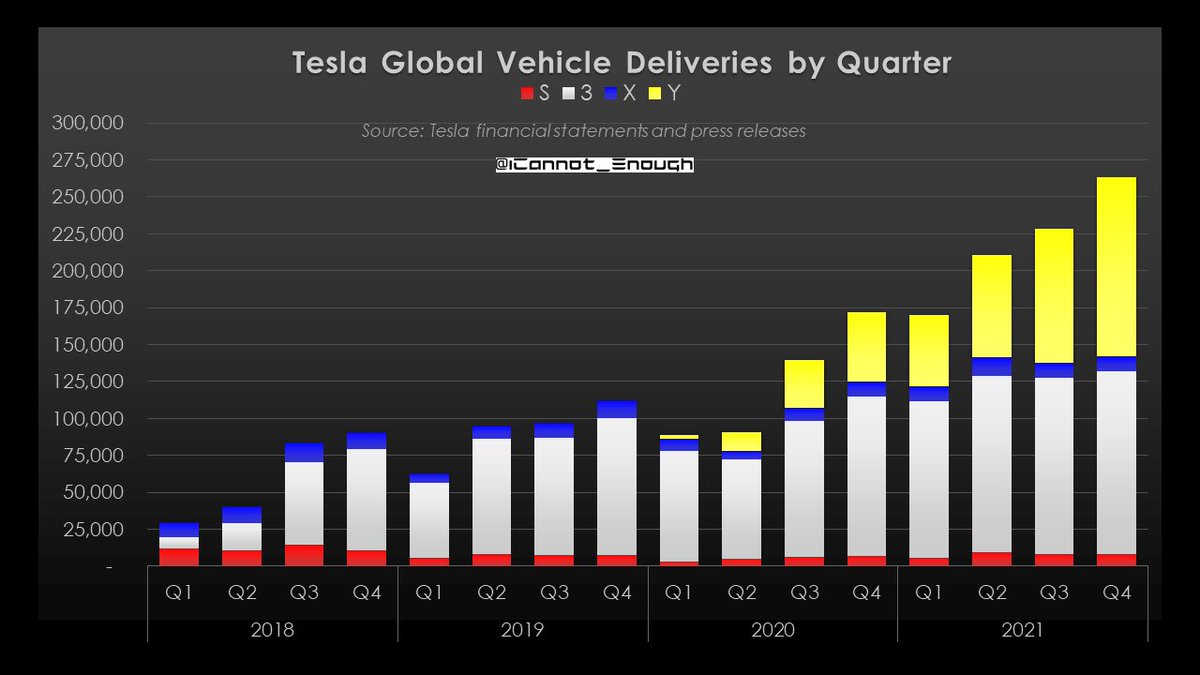
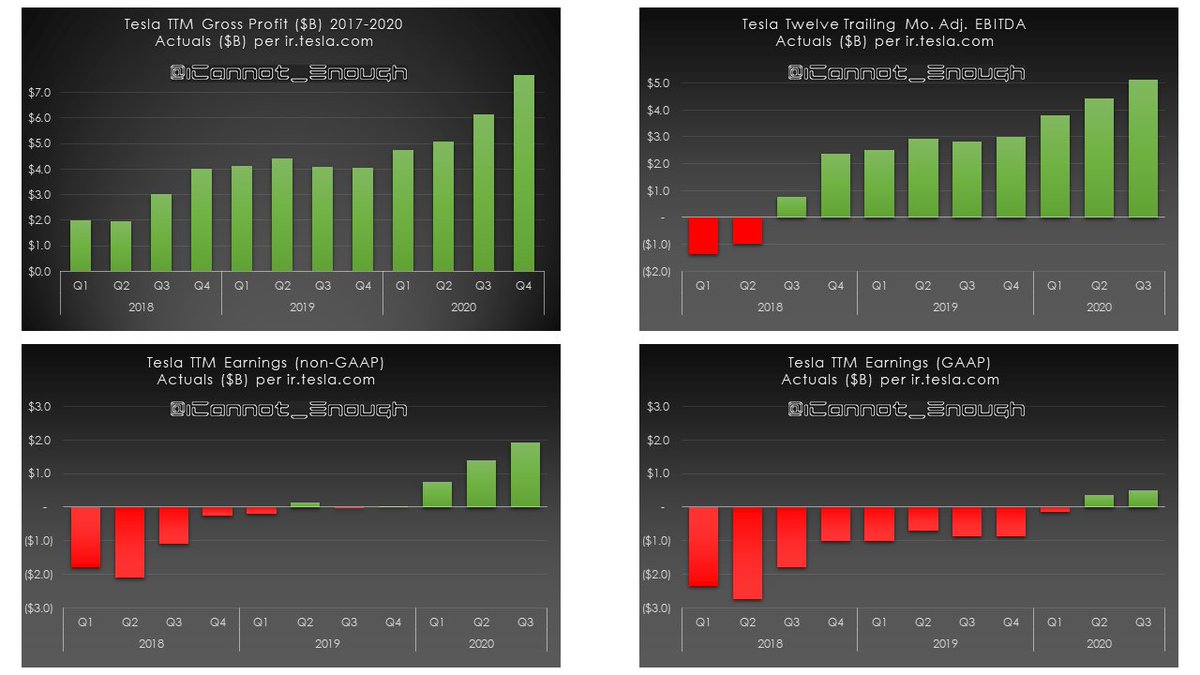
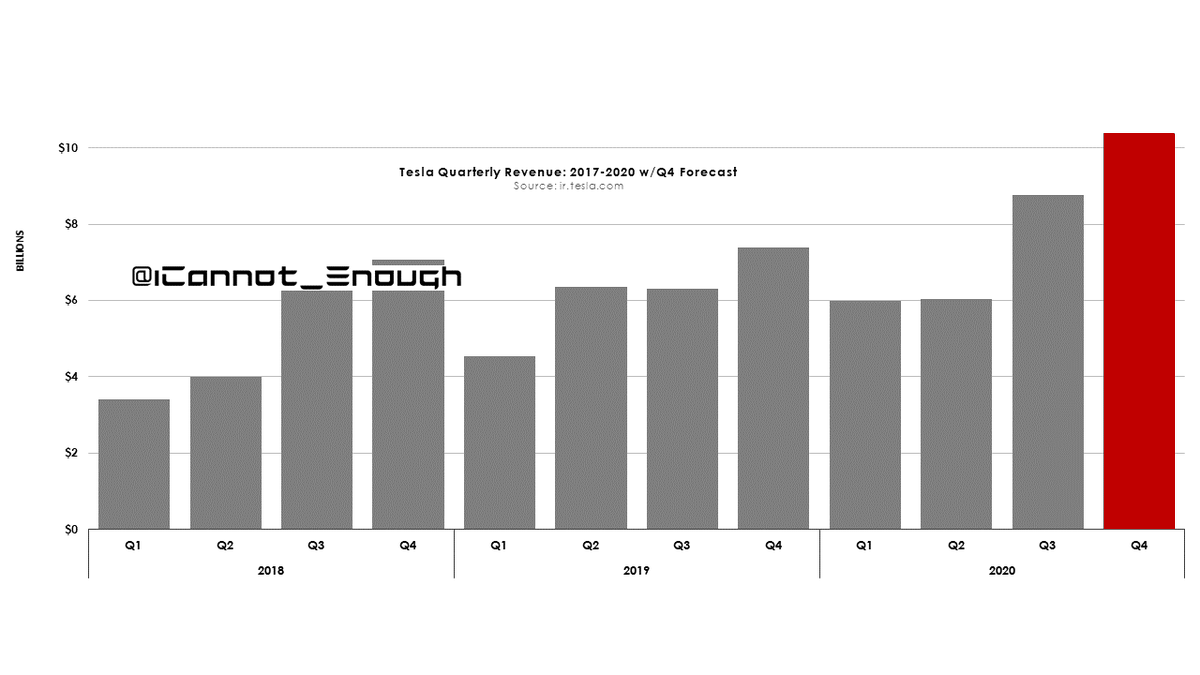
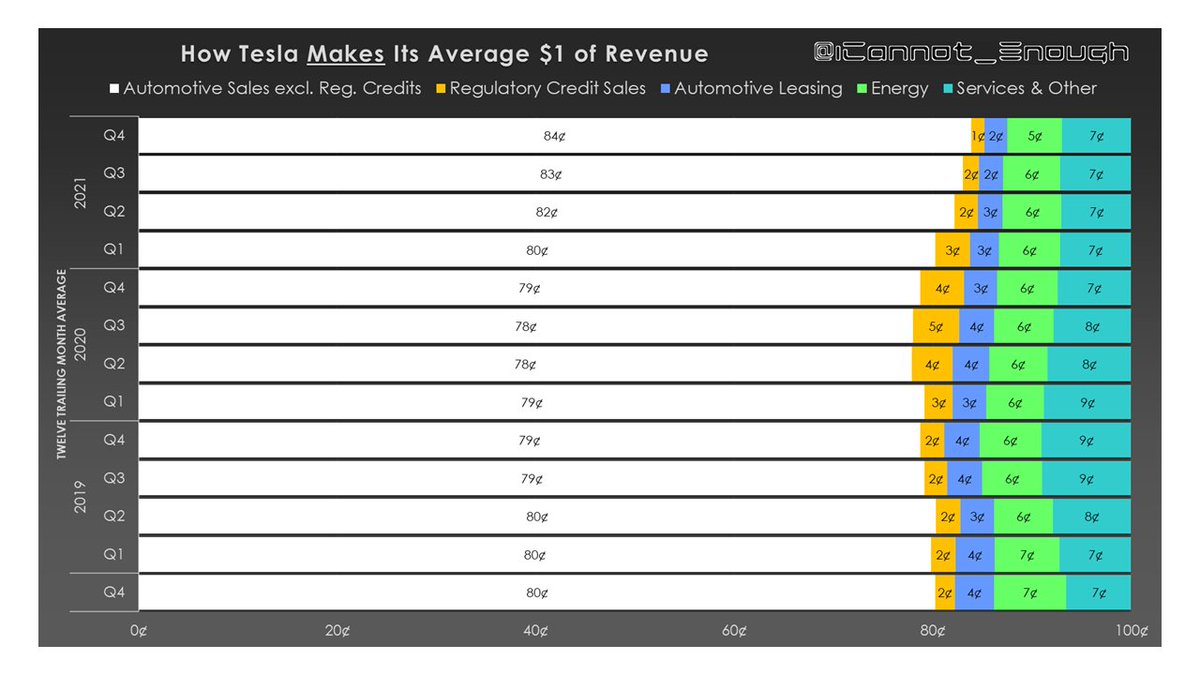
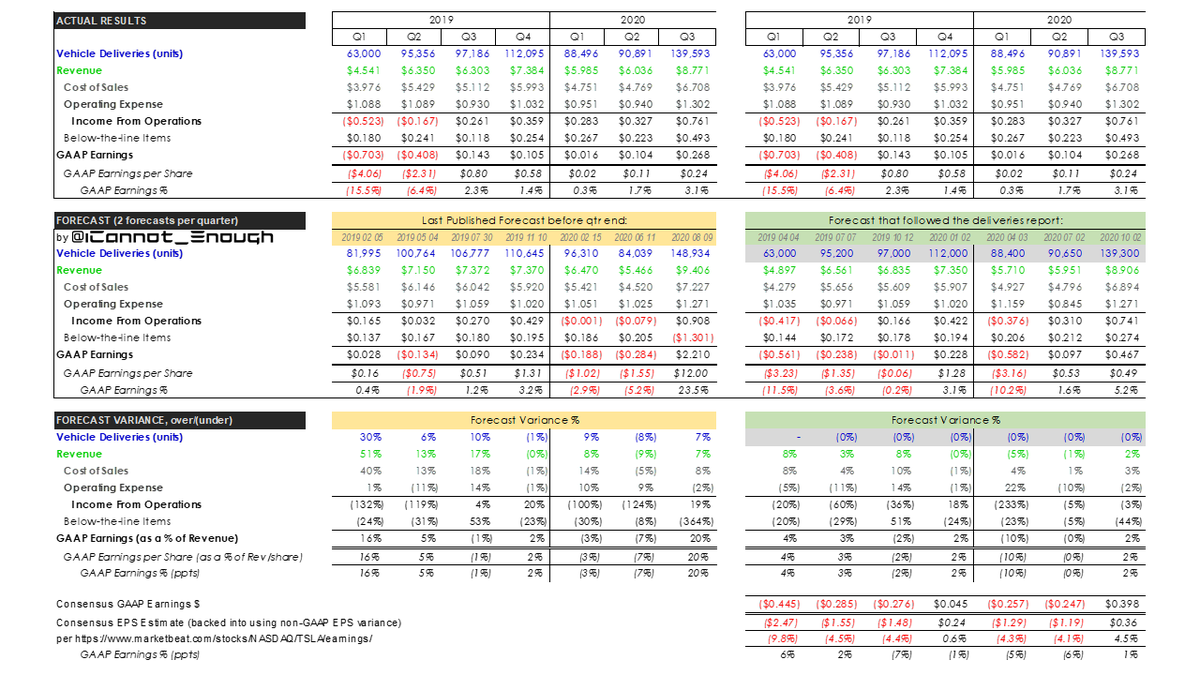
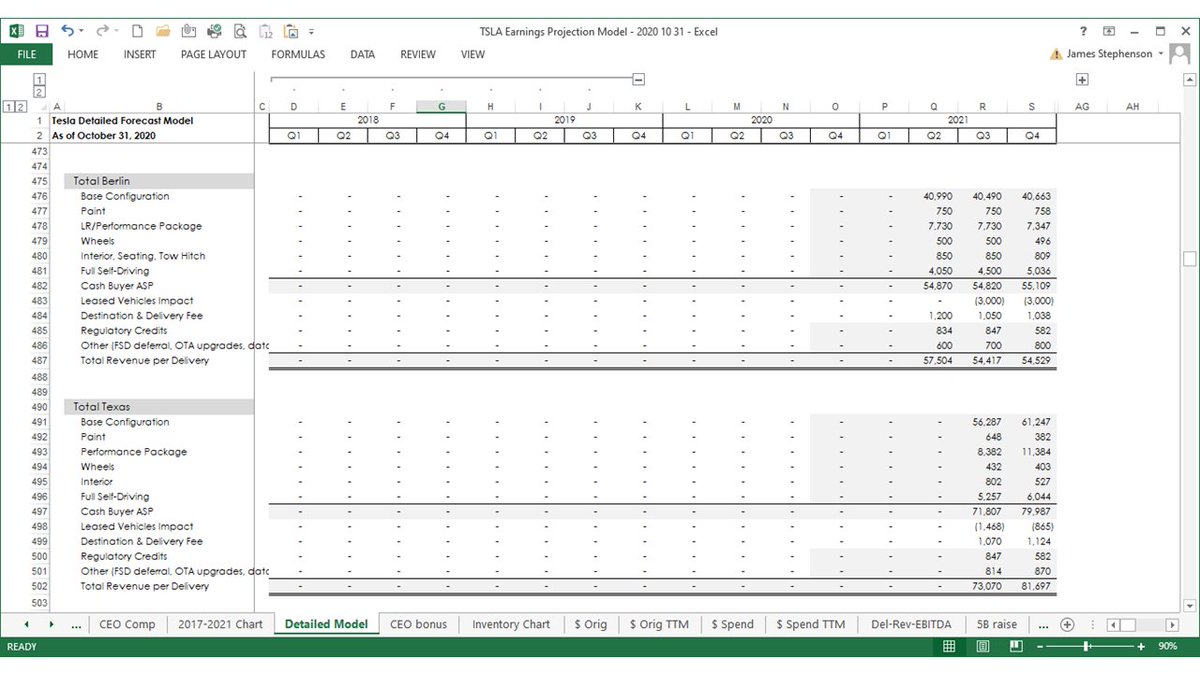
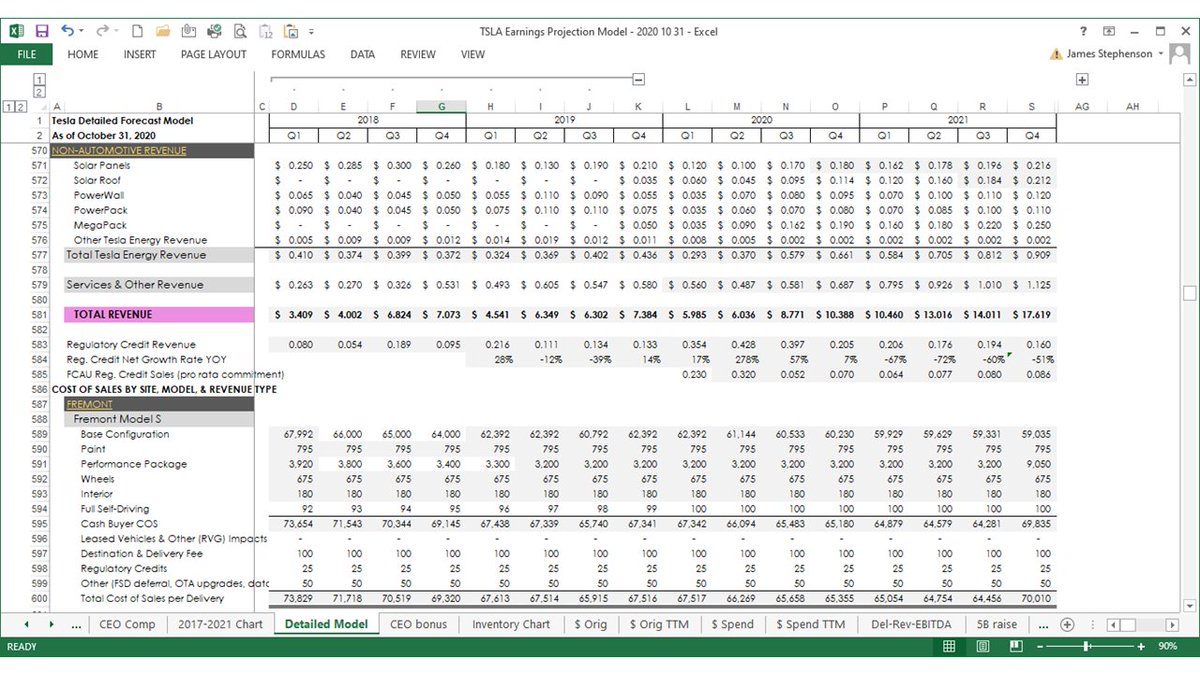
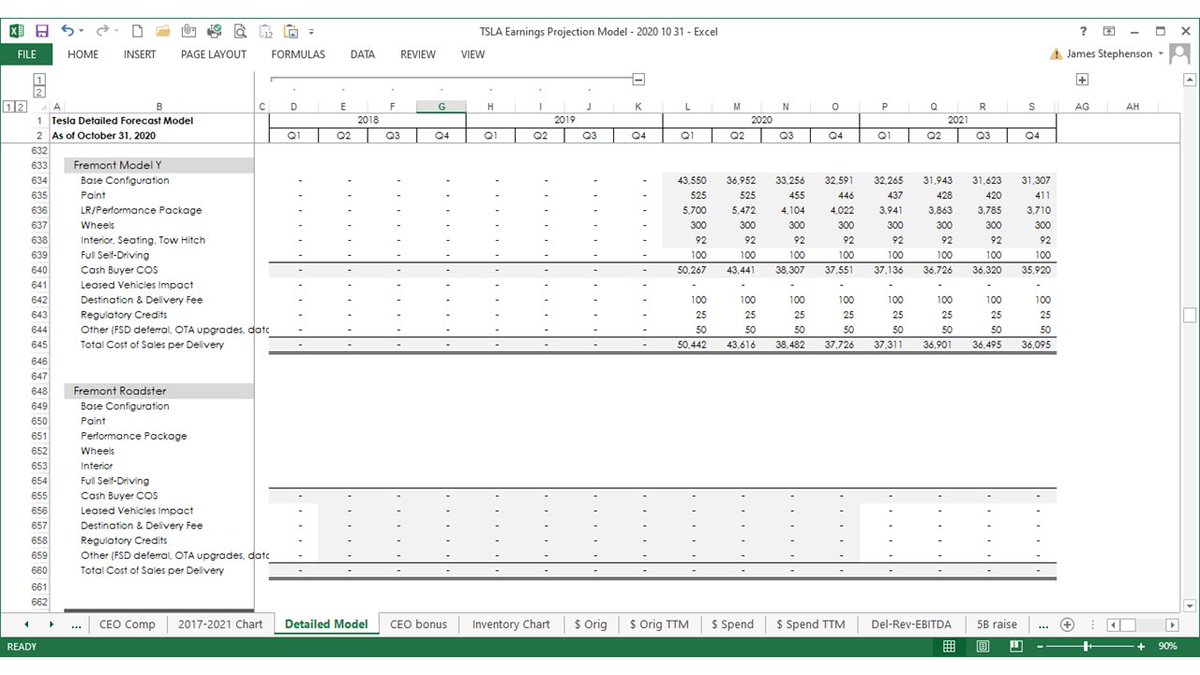
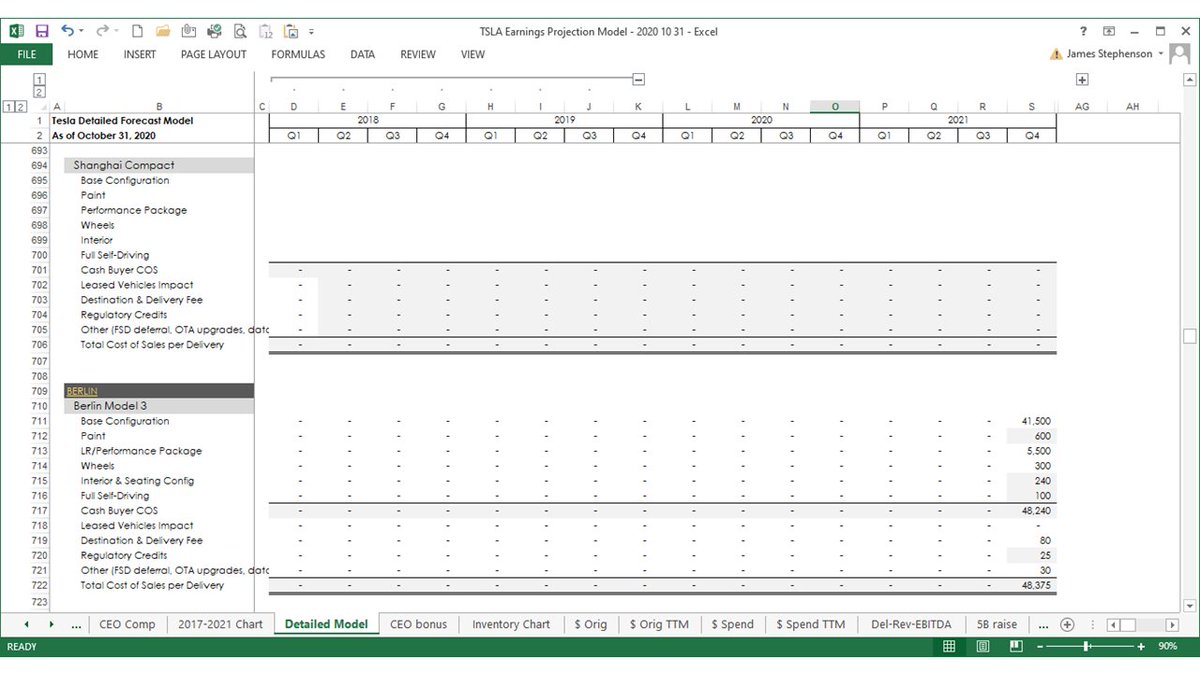
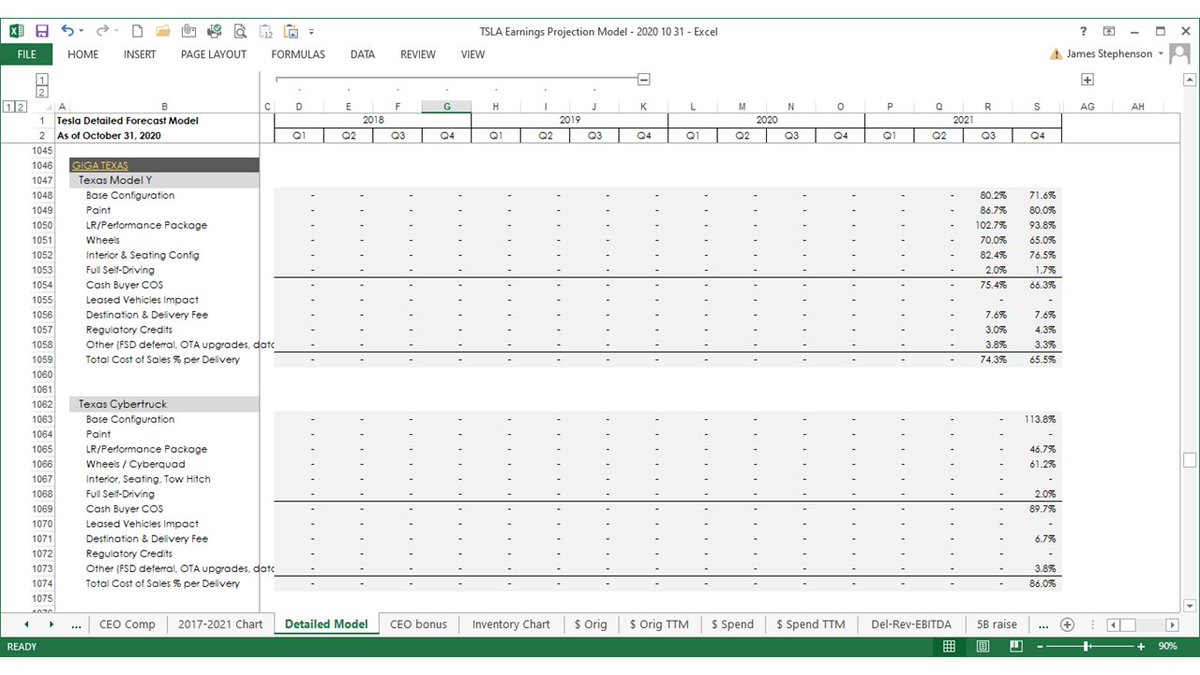
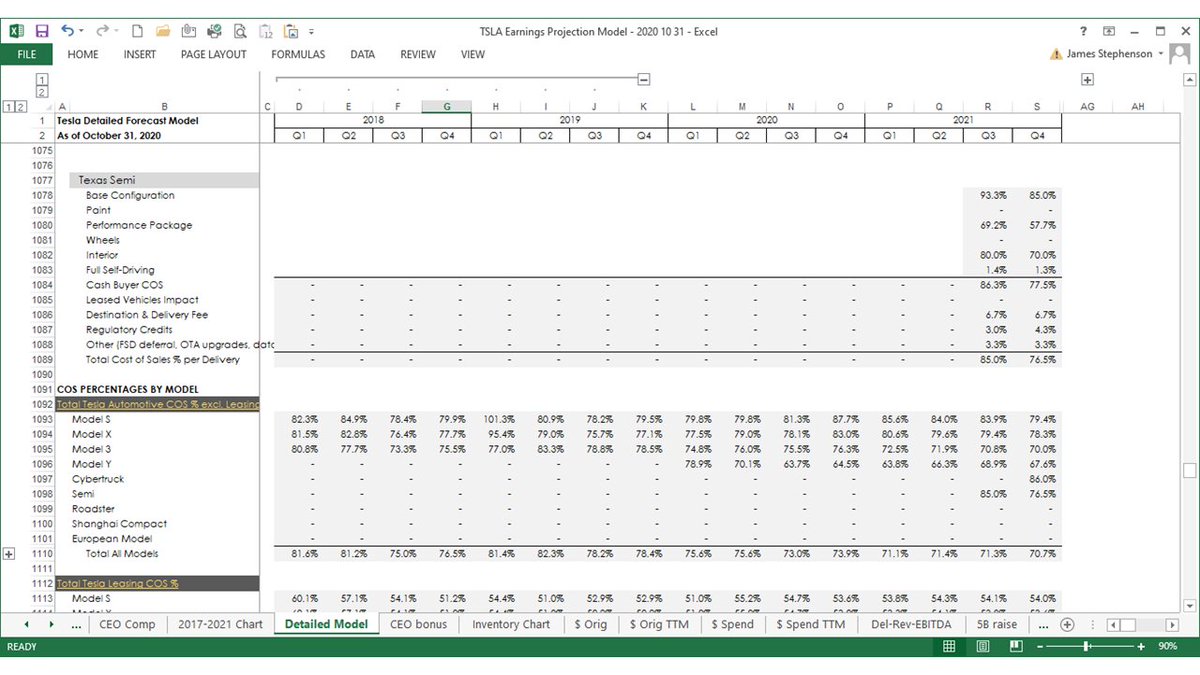
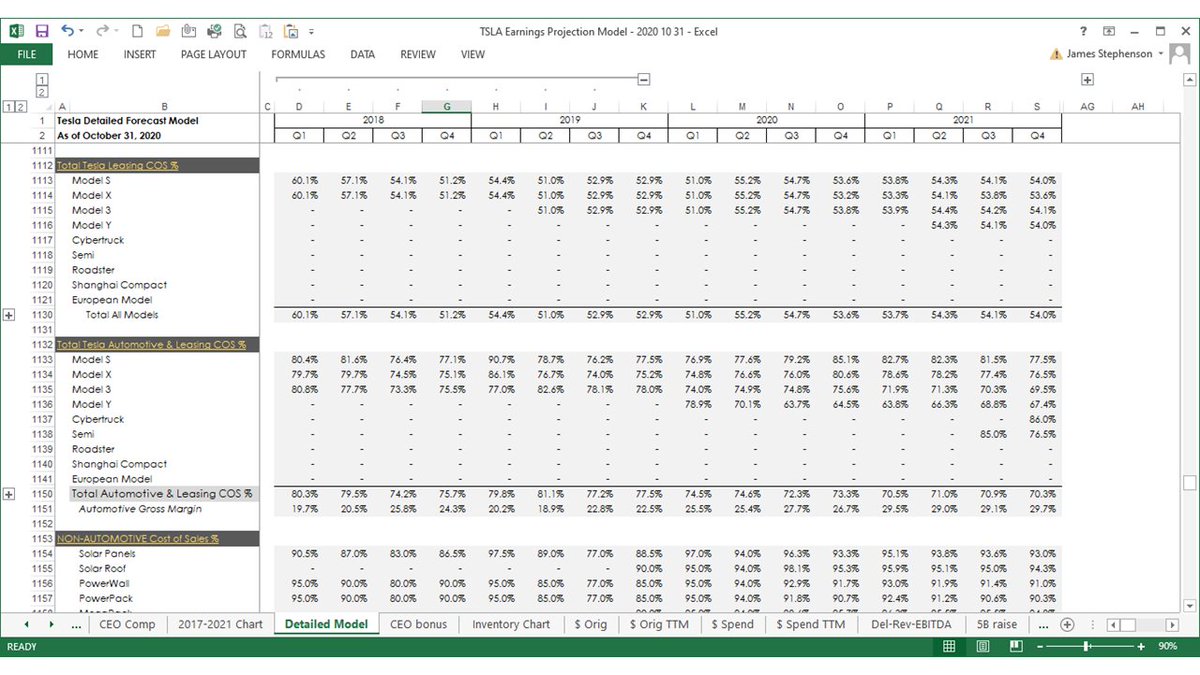
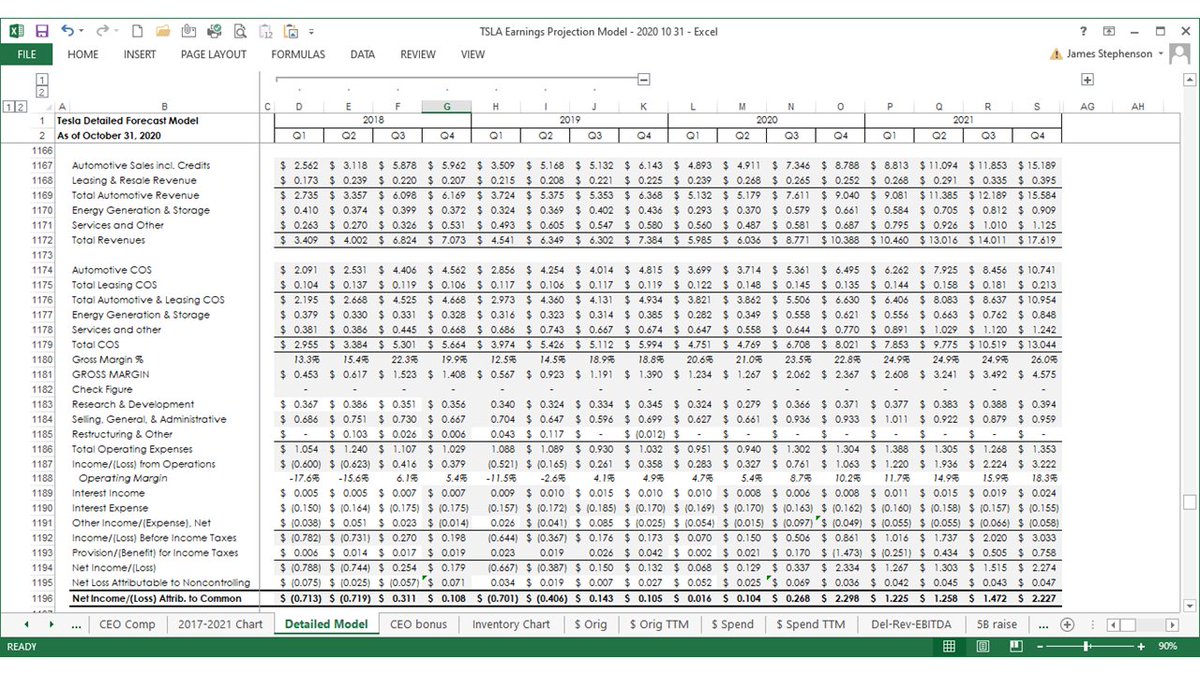
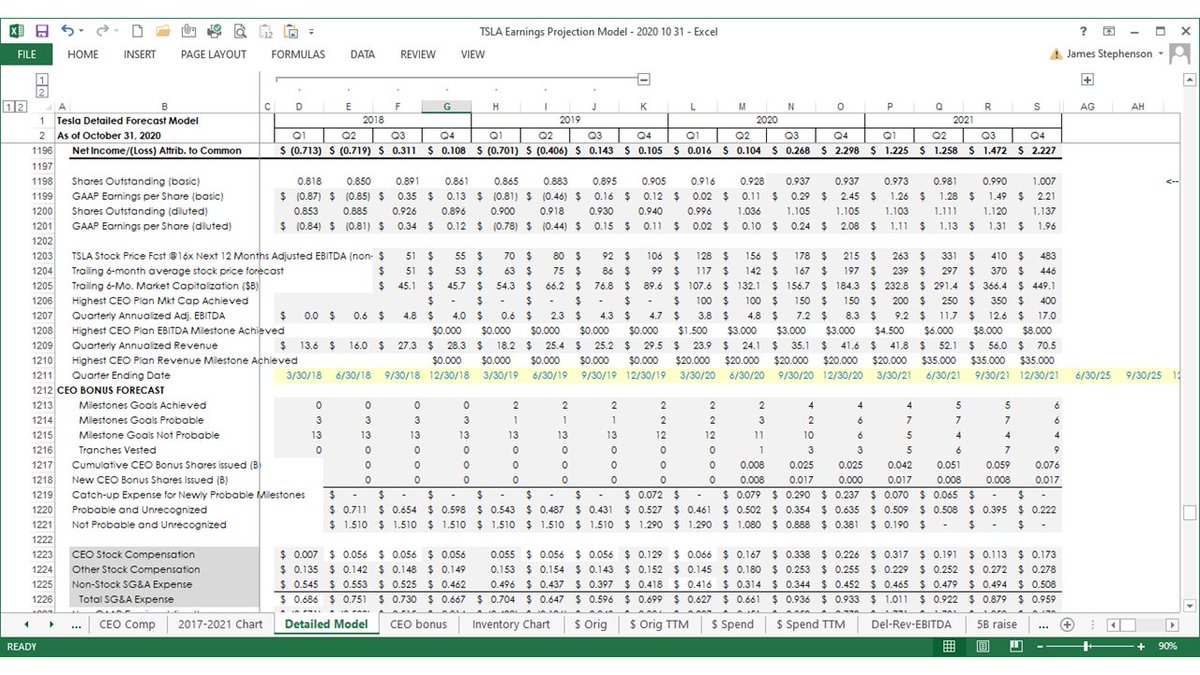
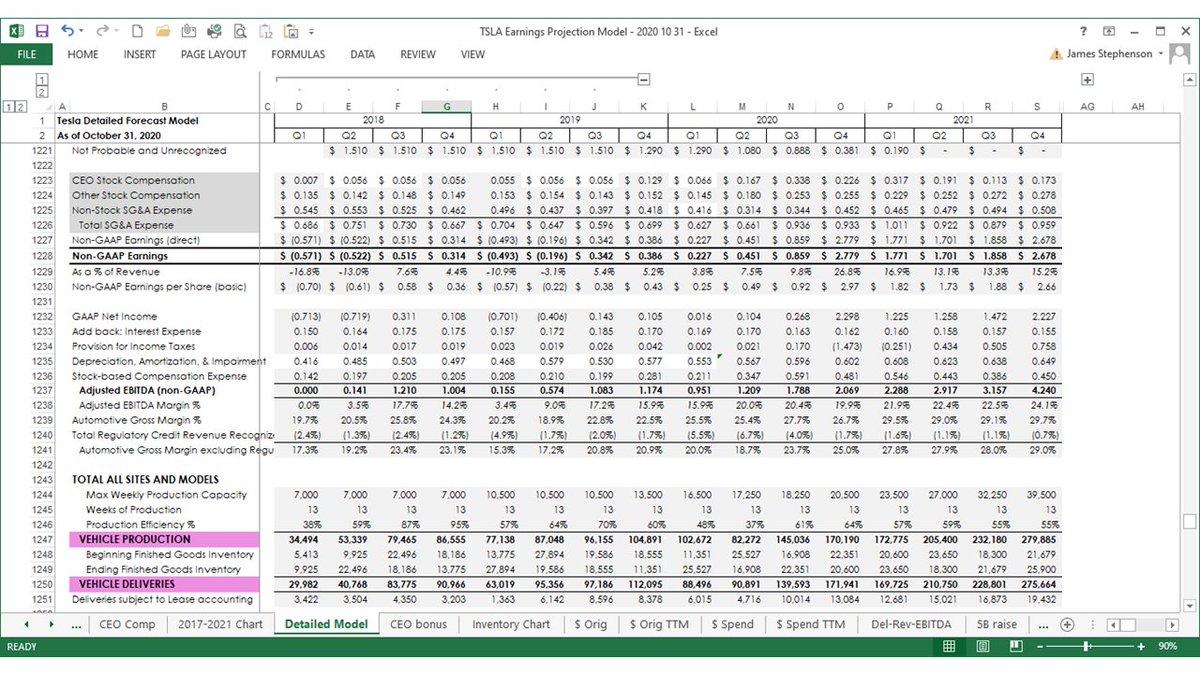
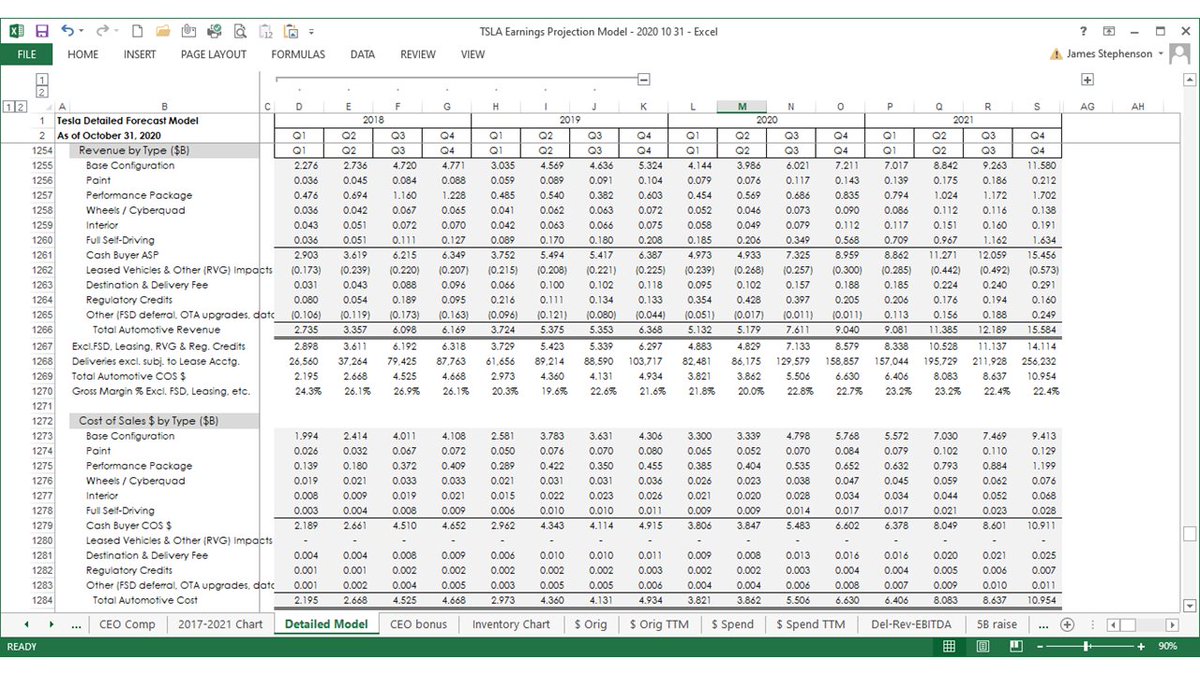
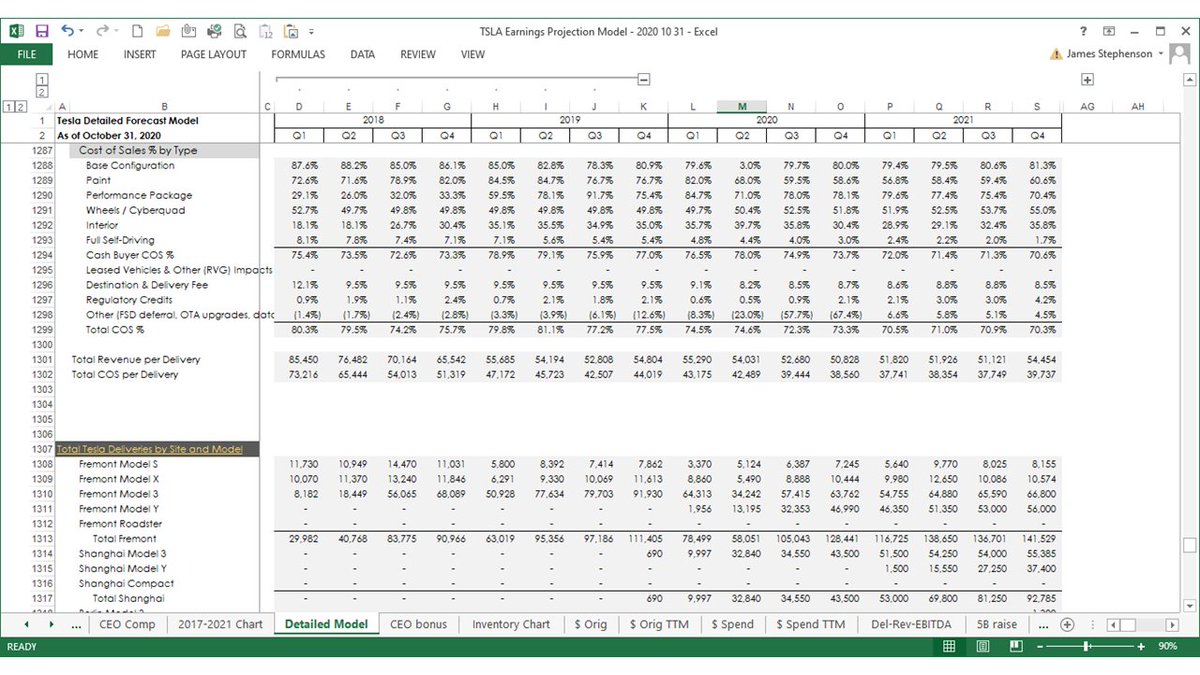
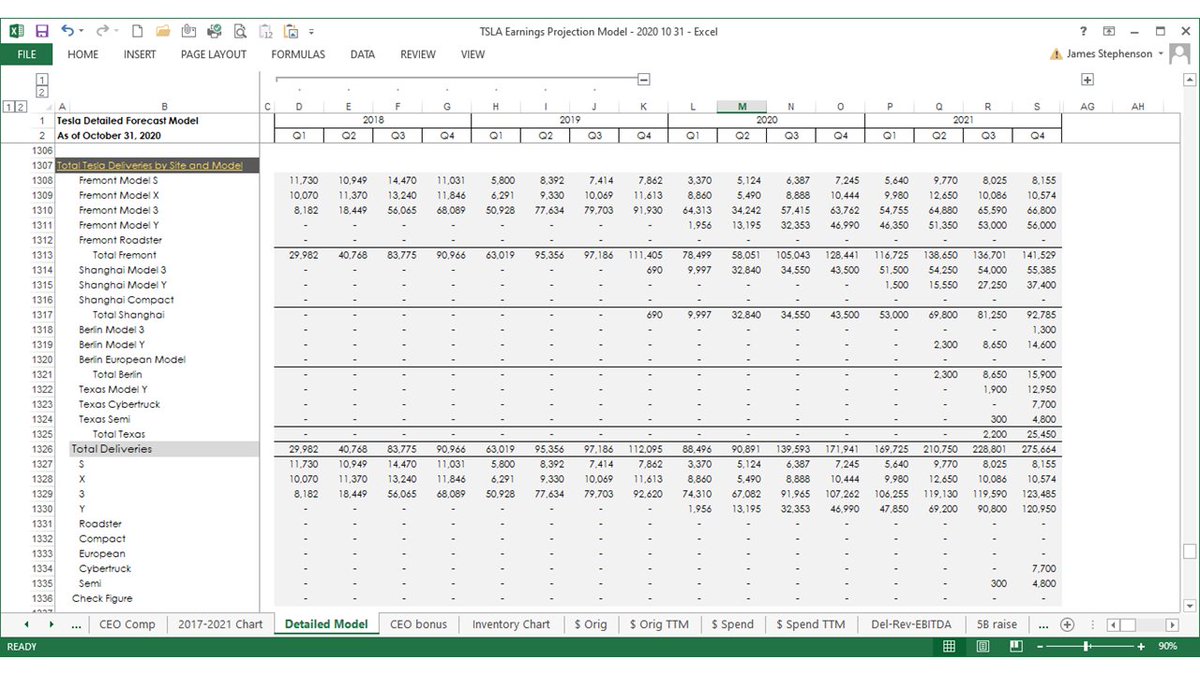
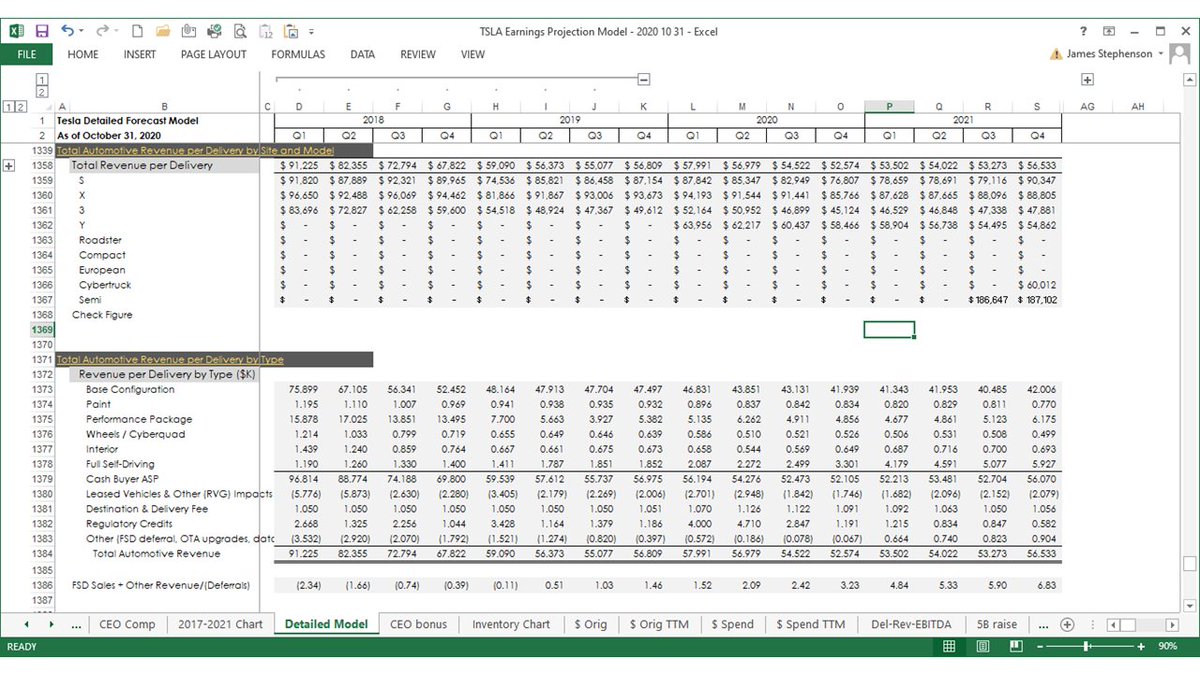
Here is my latest $TSLA forecast thread. Many numbers for those who like numbers & many charts for those who like charts.
Where does Tesla have left to go, after breaking all the records in Q3 2020?? They're just going to keep setting higher records.


Where does Tesla have left to go, after breaking all the records in Q3 2020?? They're just going to keep setting higher records.


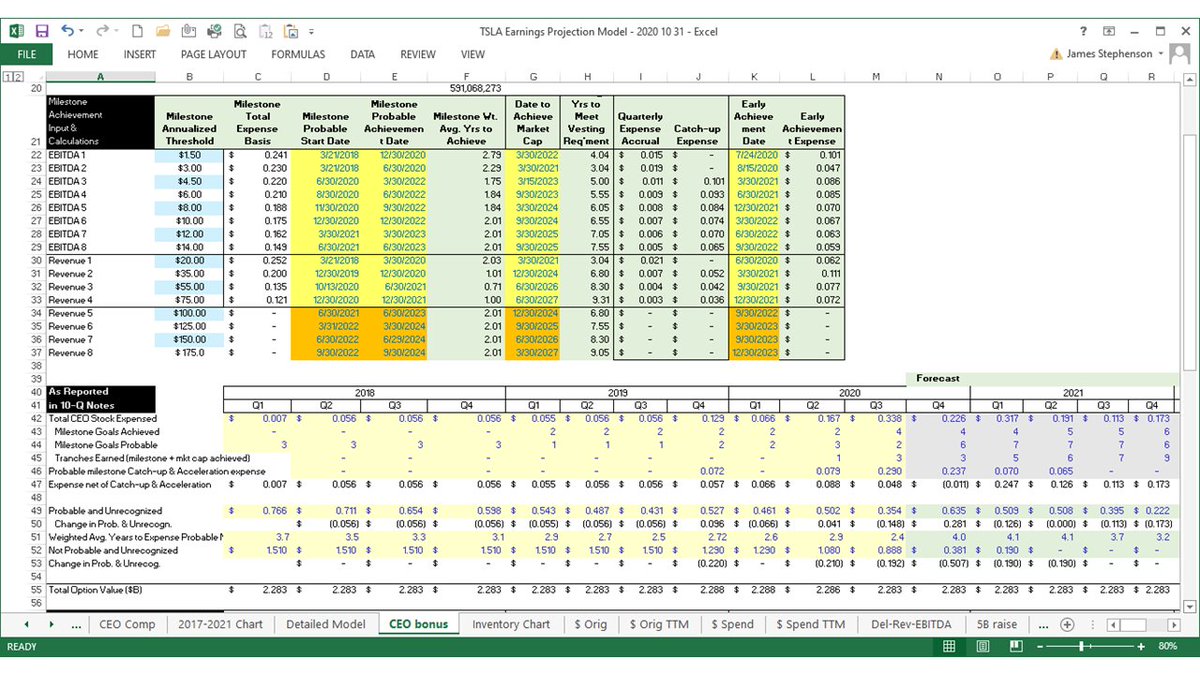
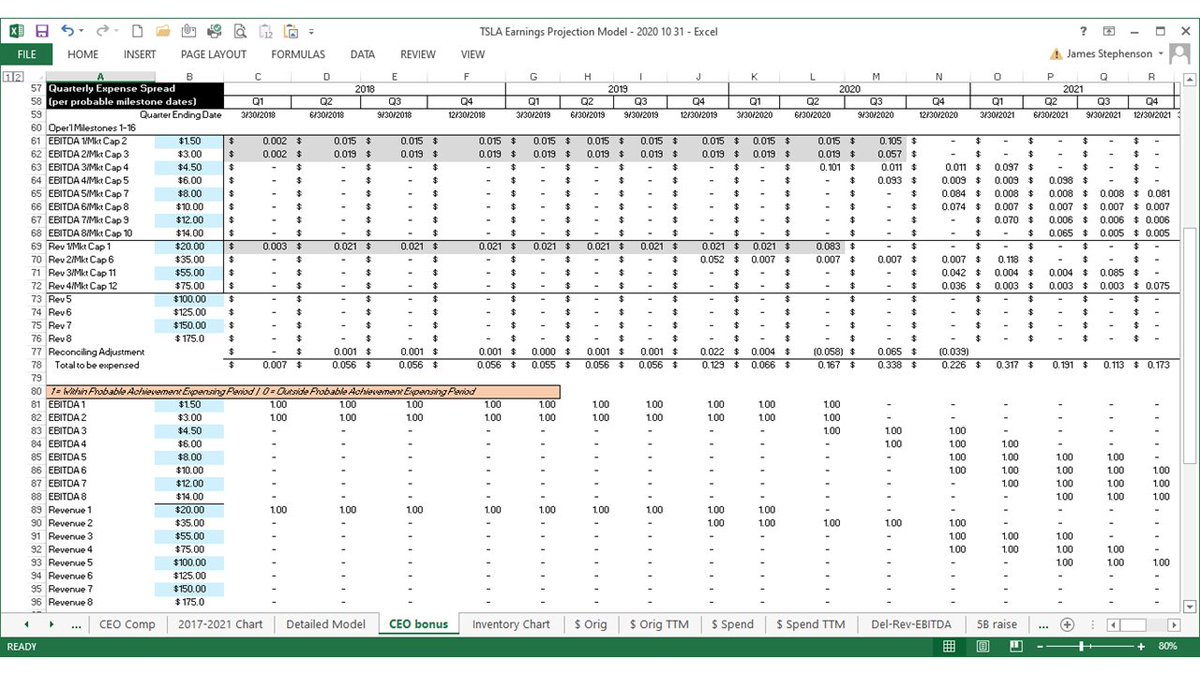
After Elon's stock-based compensation expense hit a record high in Q3, I saw some people worry that the expense will just keep rising every quarter. Fear not, $TSLA owner: that non-cash expense a) isn't real and b) has probably peaked (see 4th slide).
These charts are just different ways of showing Tesla's revenue growth and improving cost efficiencies which together lead to increasing profitability.
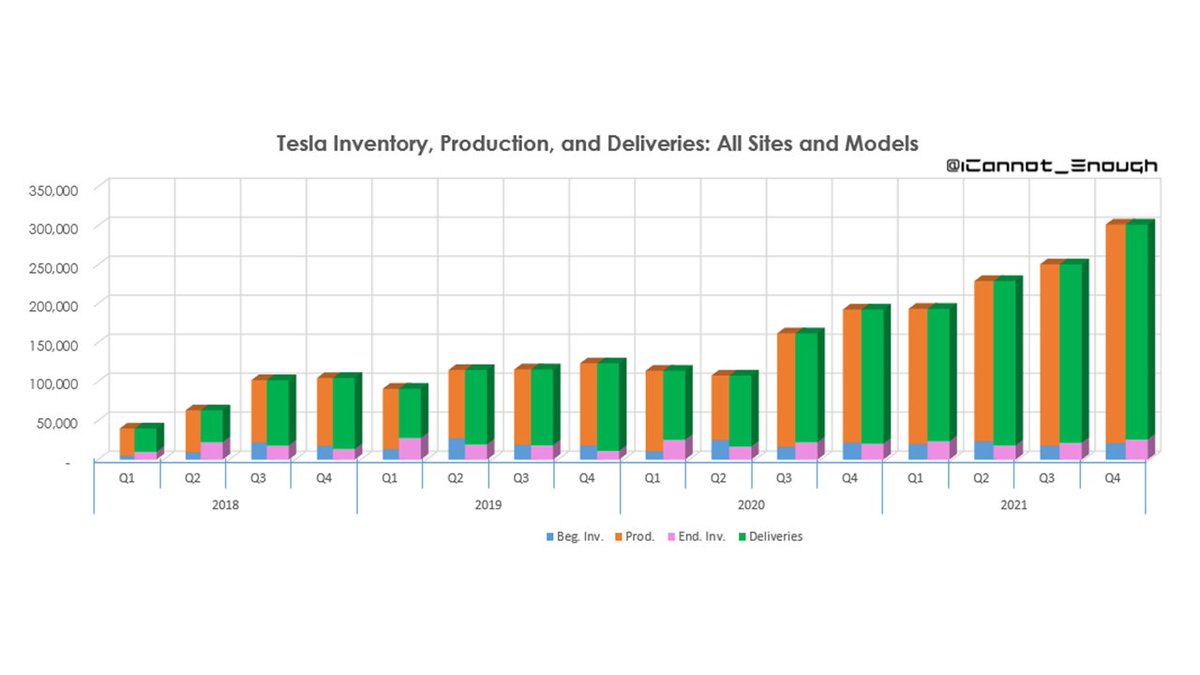
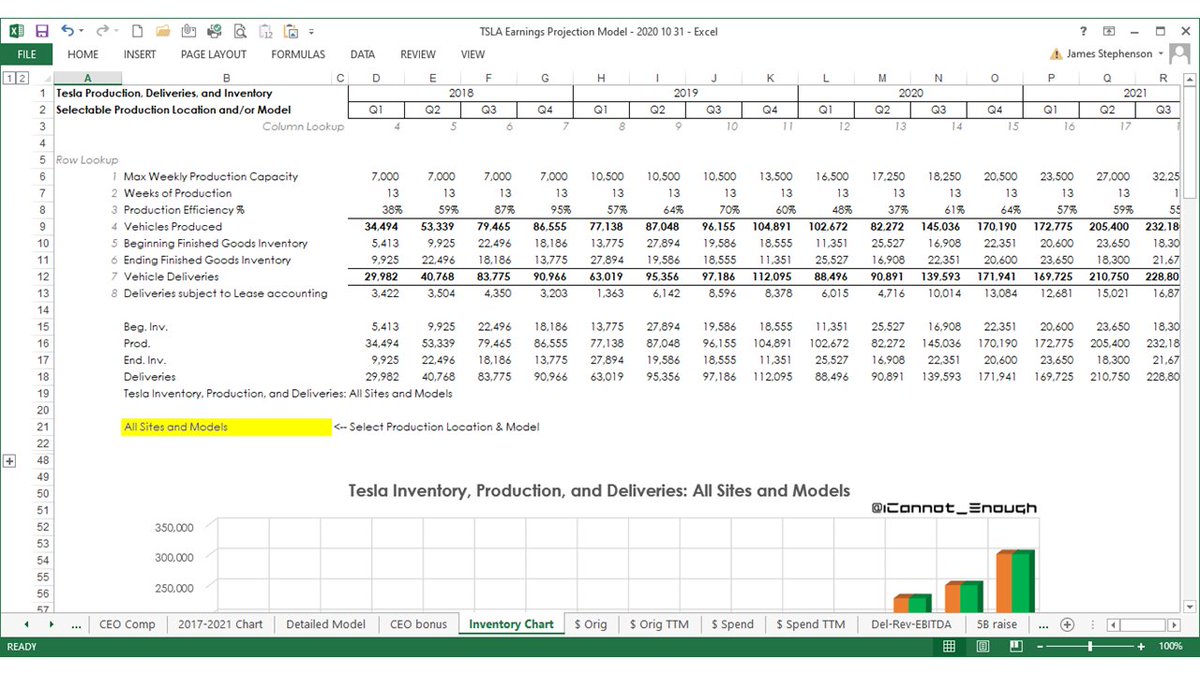
Wrapping up the charts section, a few showing production, deliveries, and finished goods inventory, unit sales by model and site, and my historical forecast accuracy. Sometimes people ask.
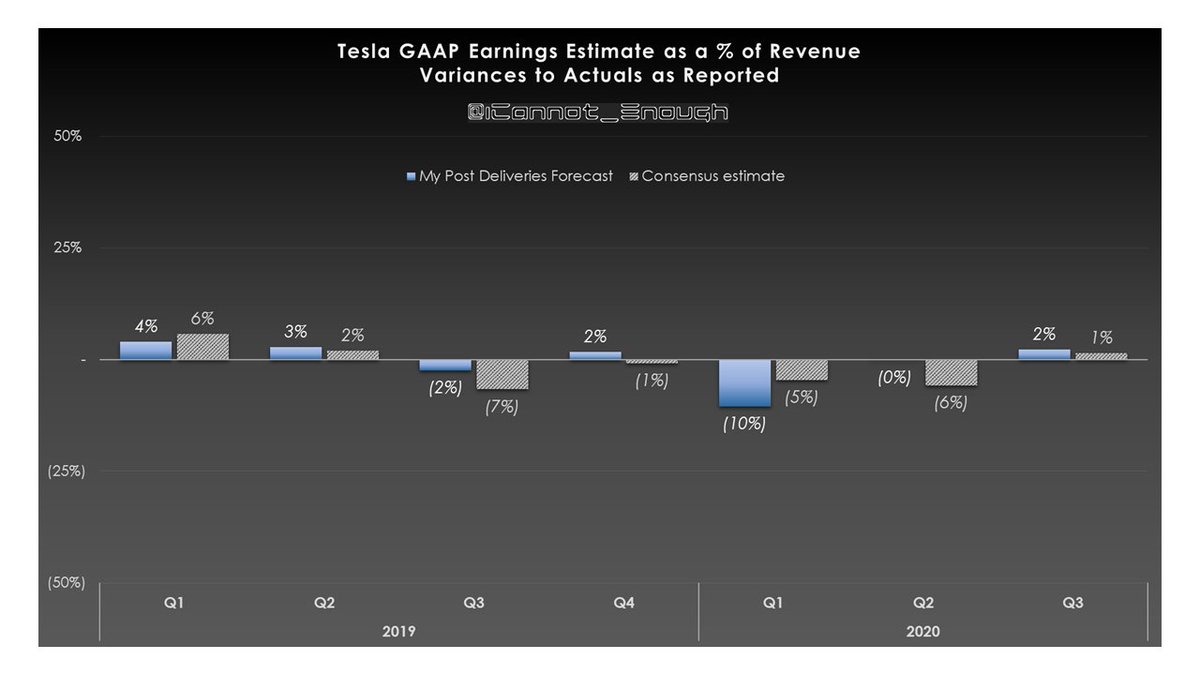
My revenue and earnings have been within ~2% in 3 of the last 4 quarters.
My revenue and earnings have been within ~2% in 3 of the last 4 quarters.
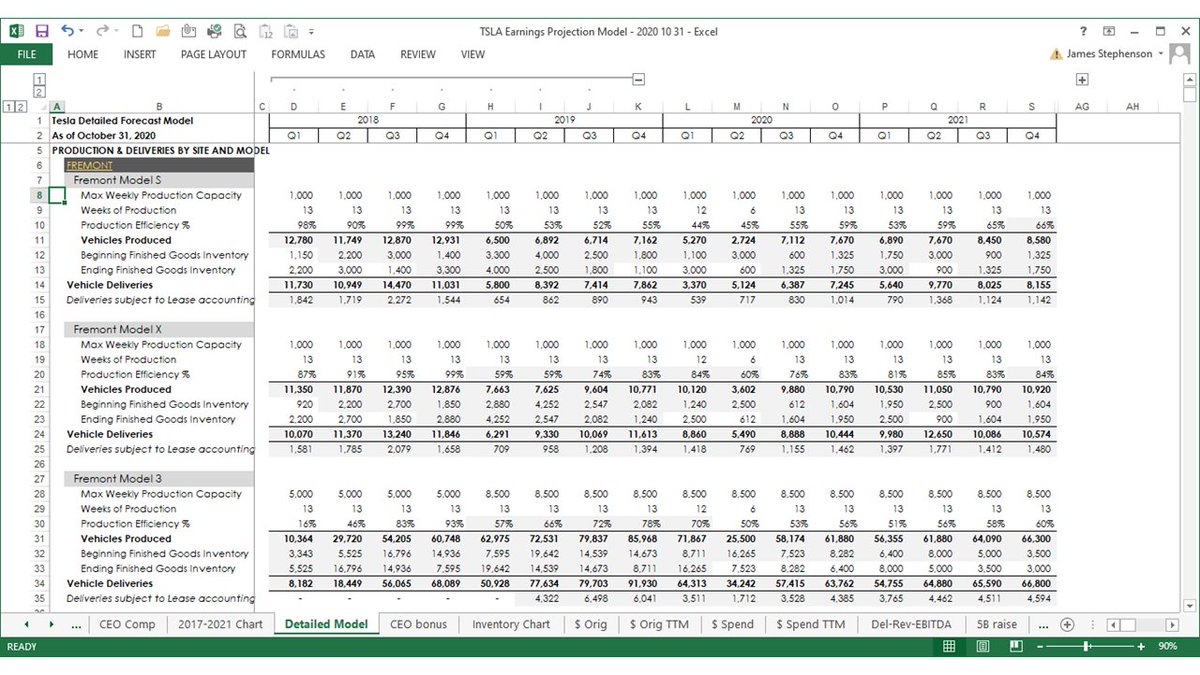
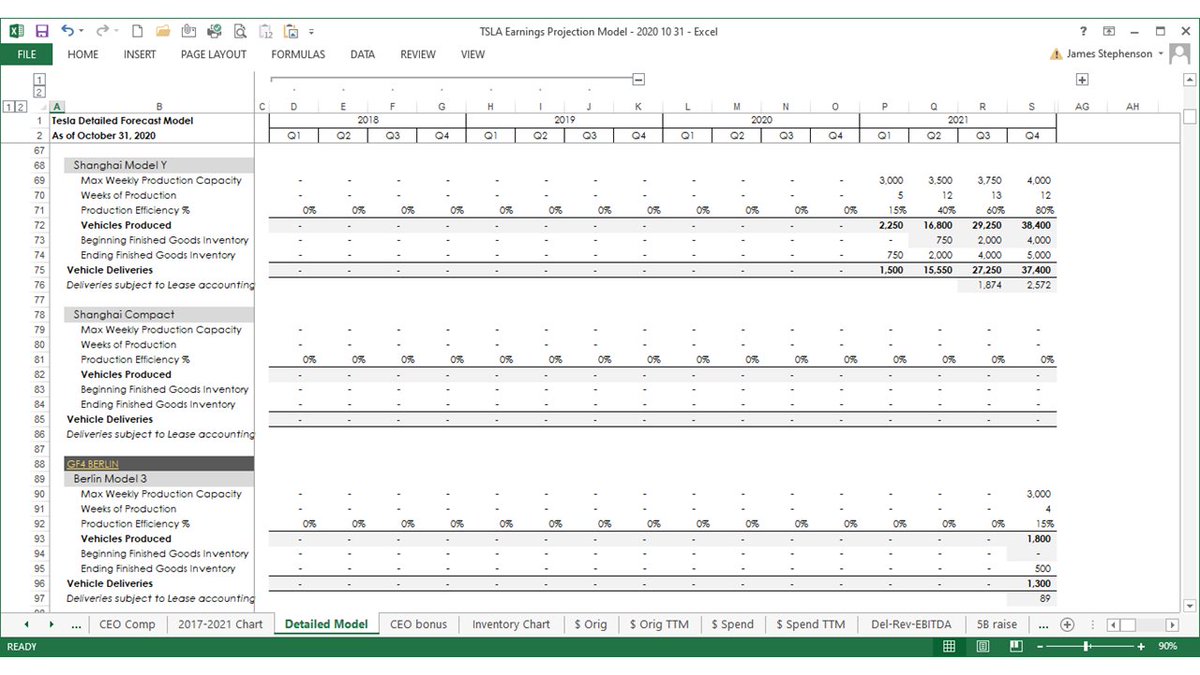
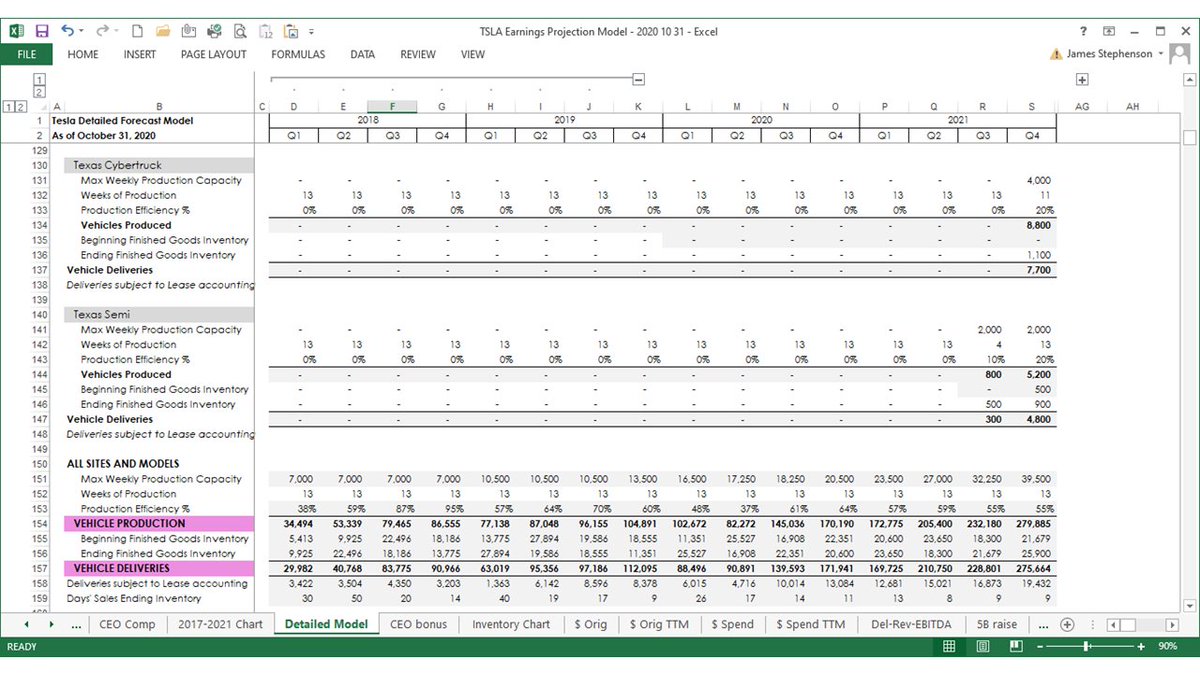
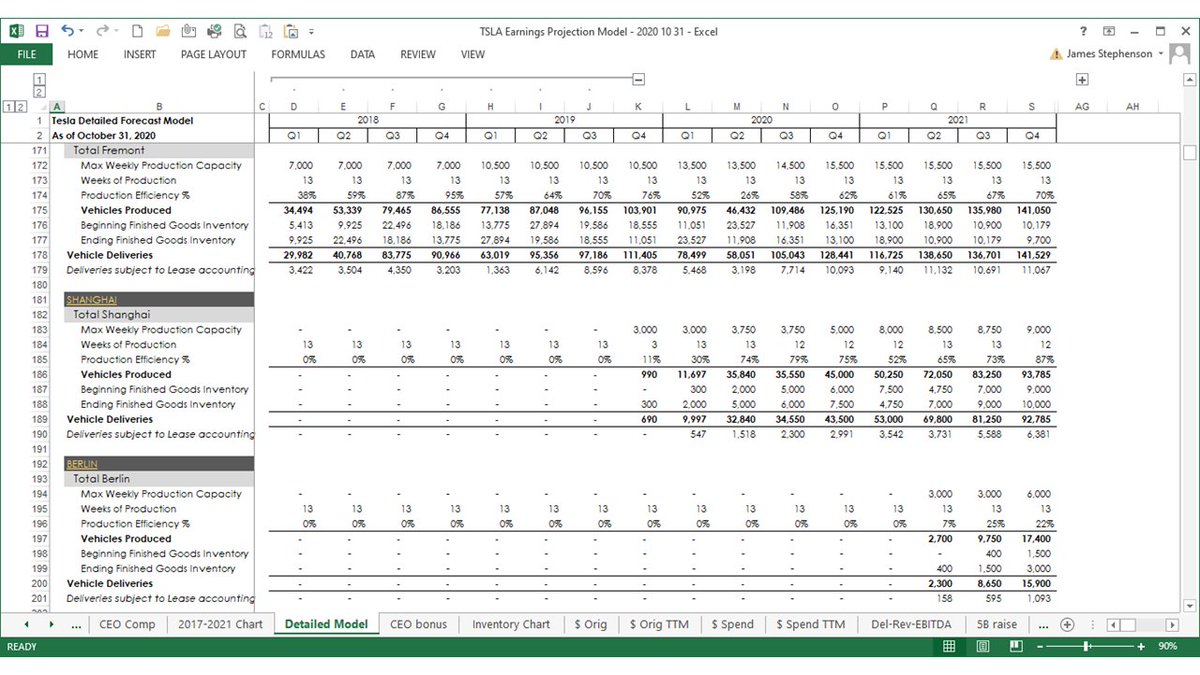
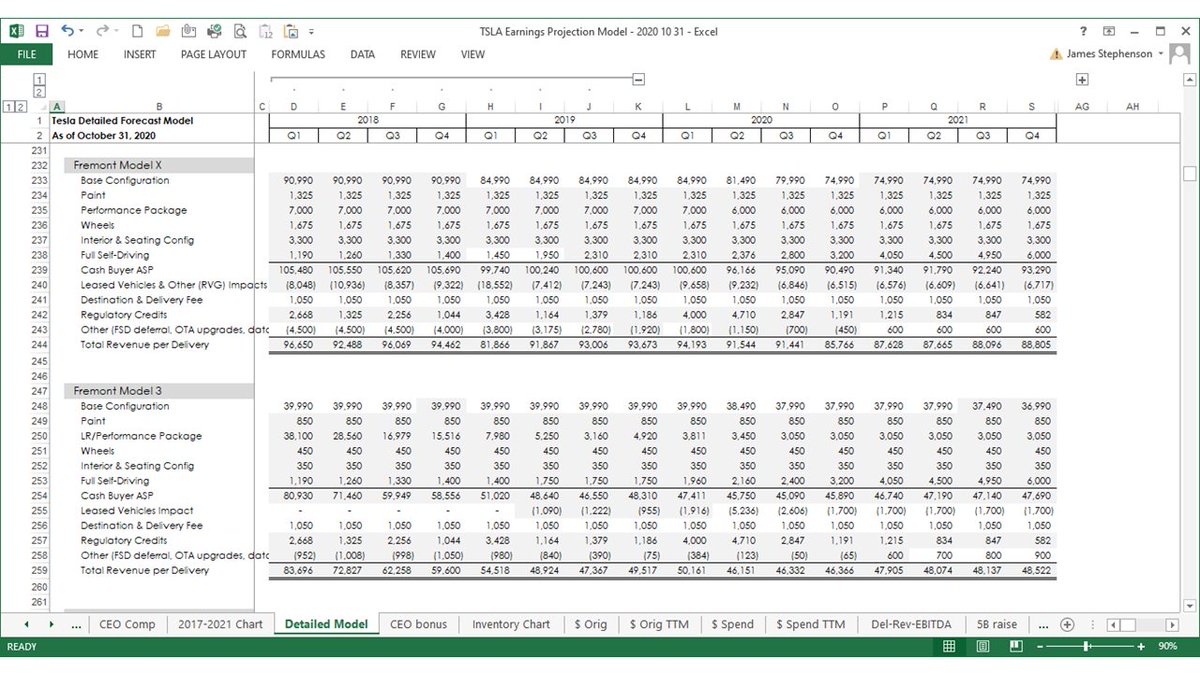
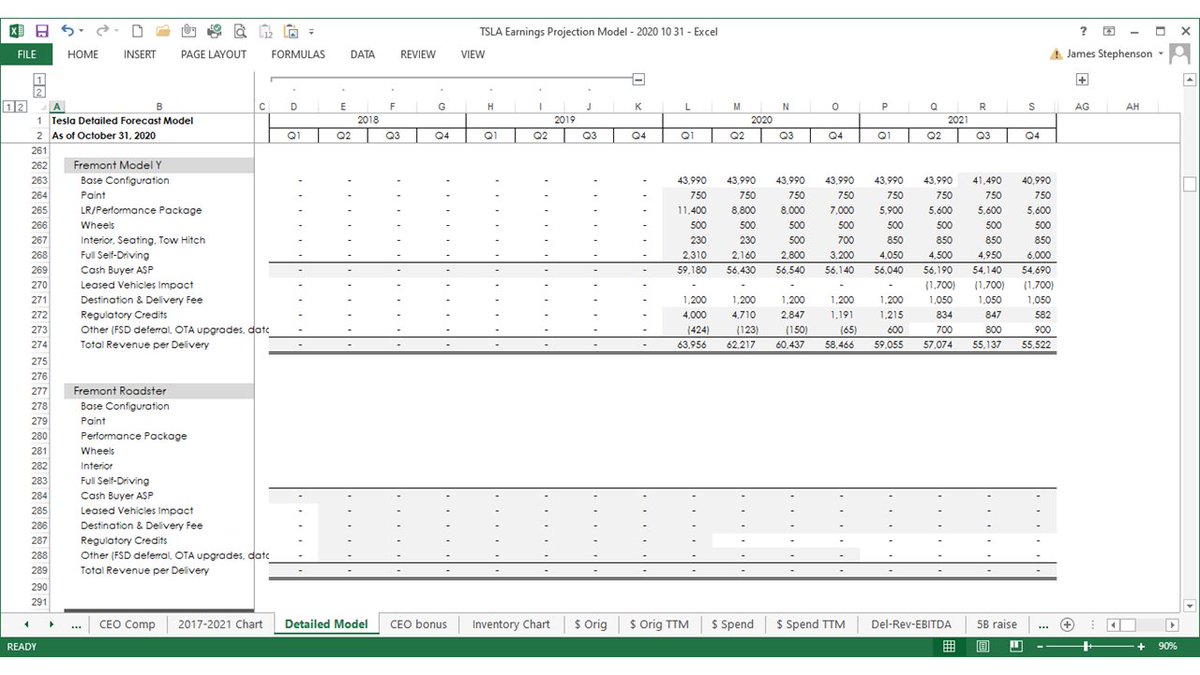
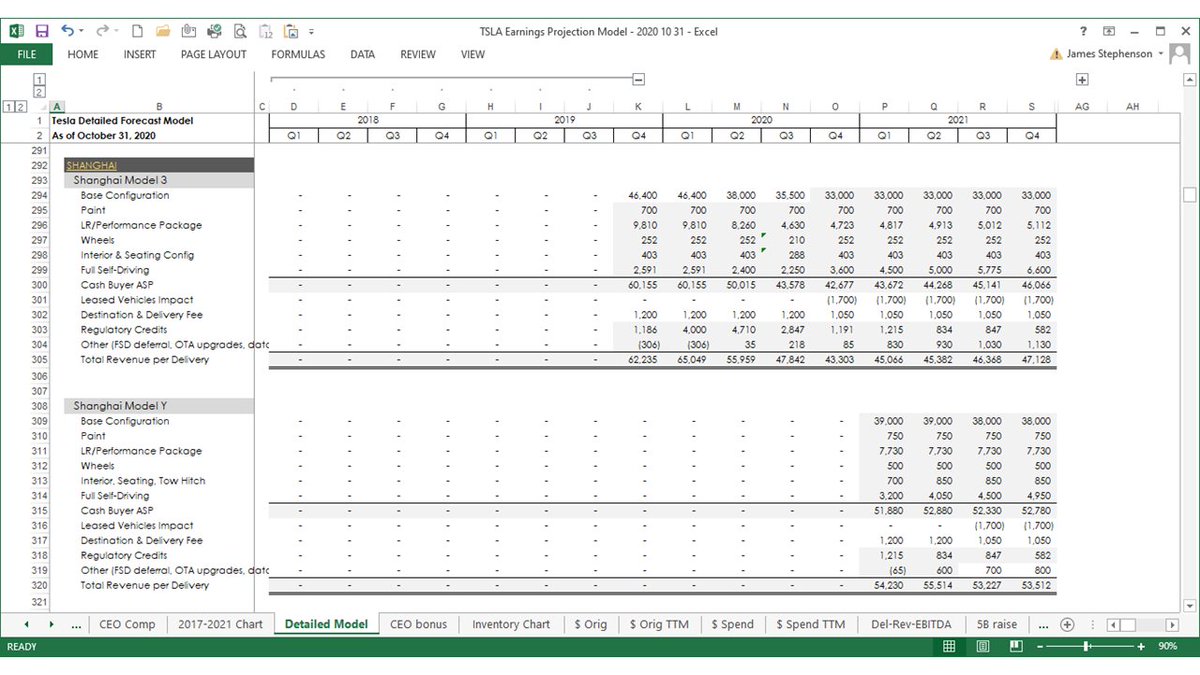
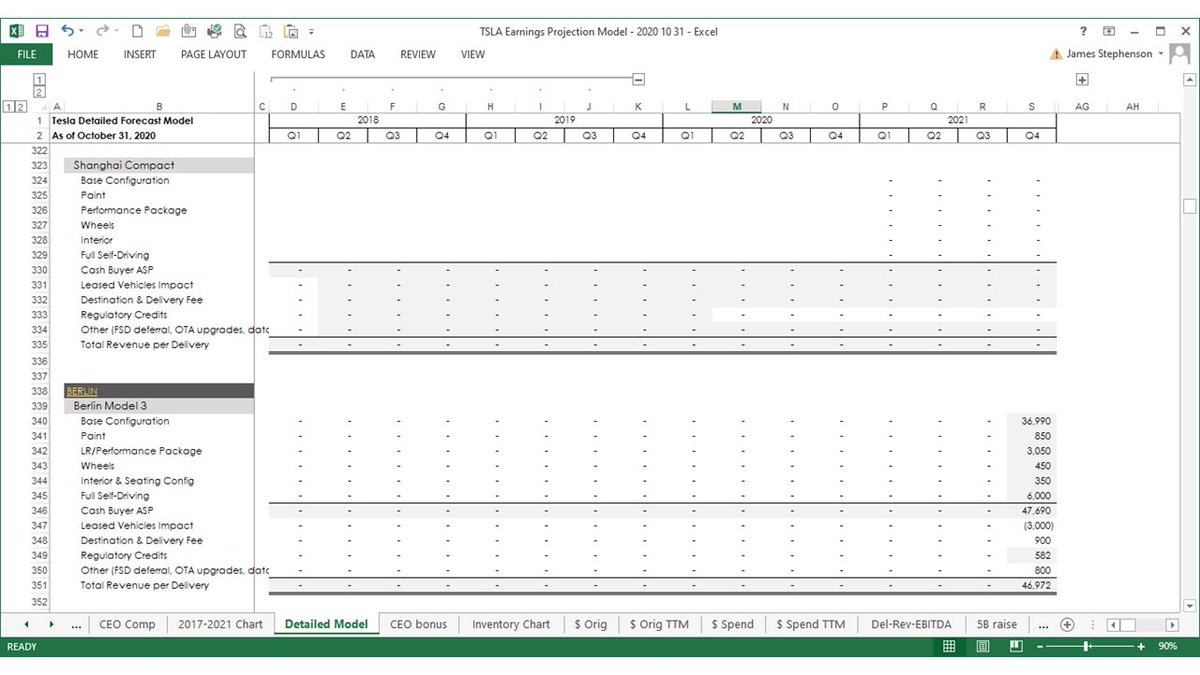
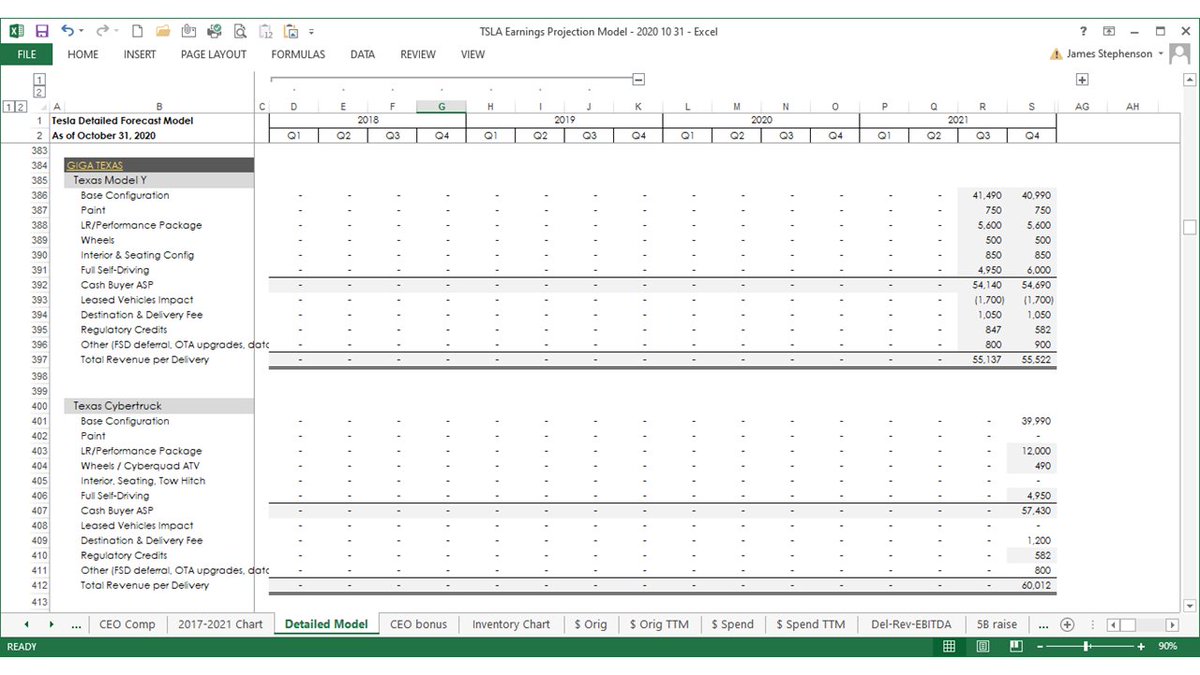
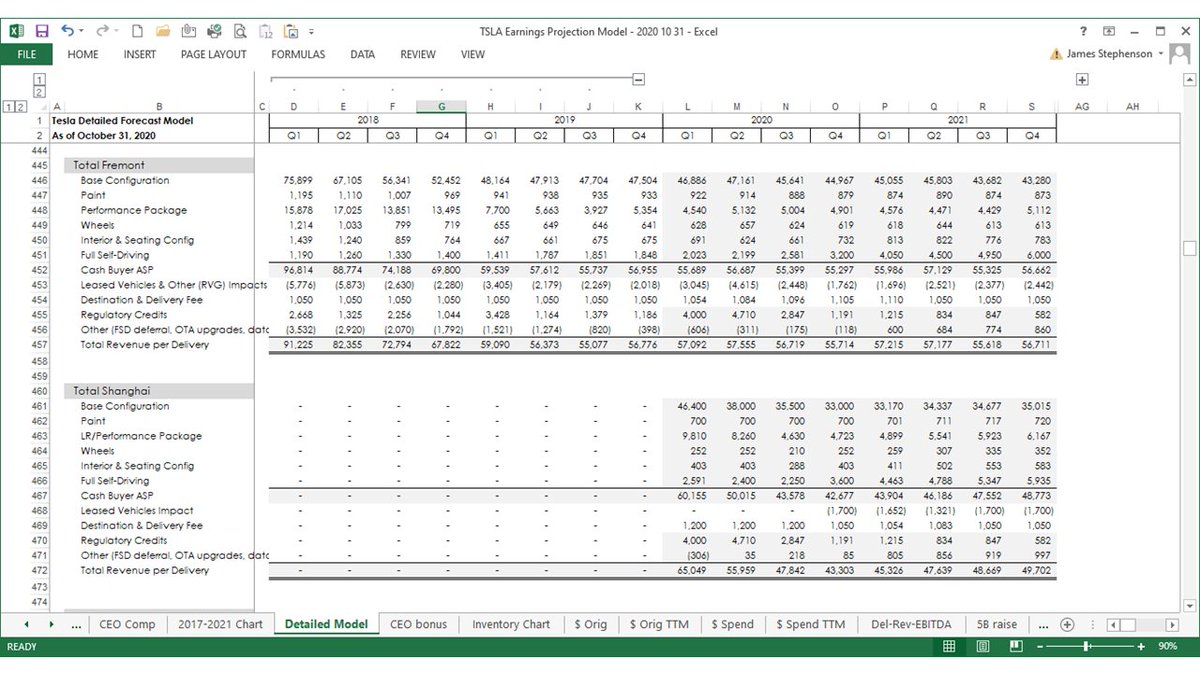
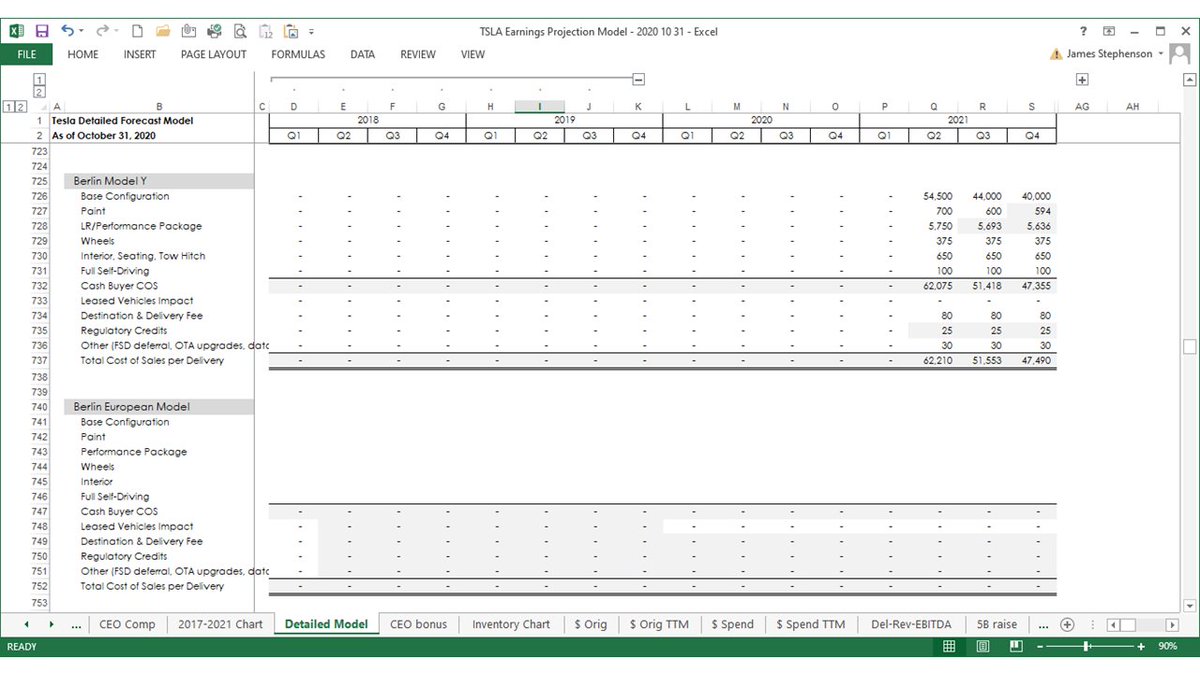
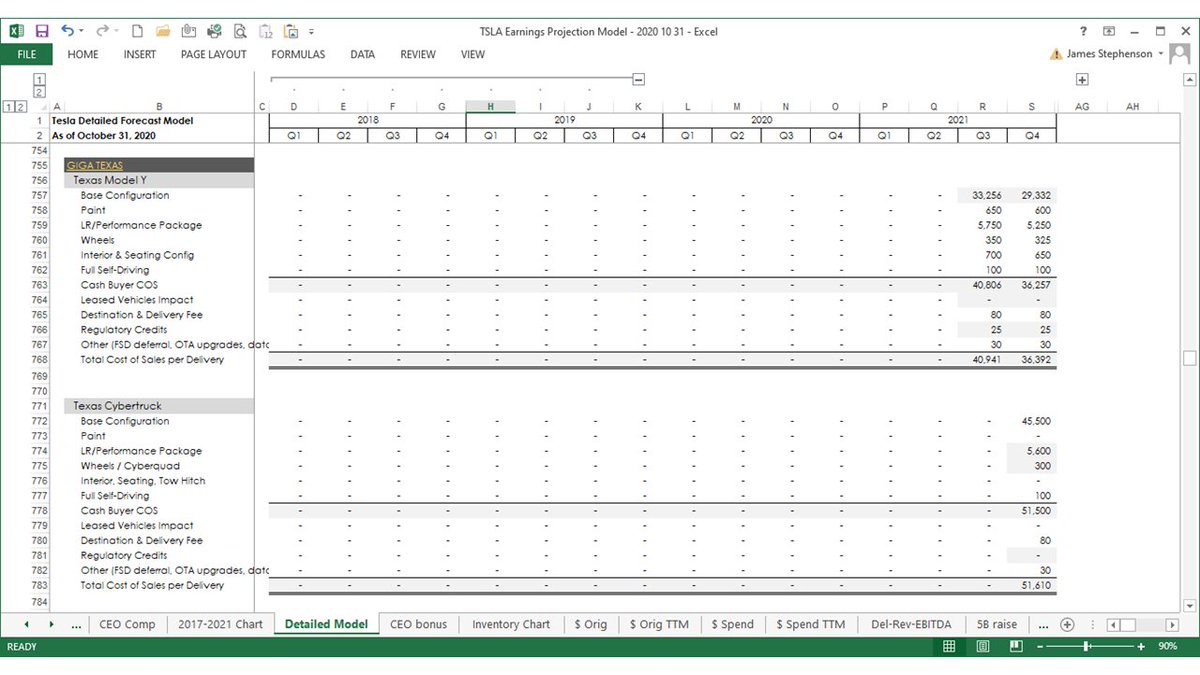
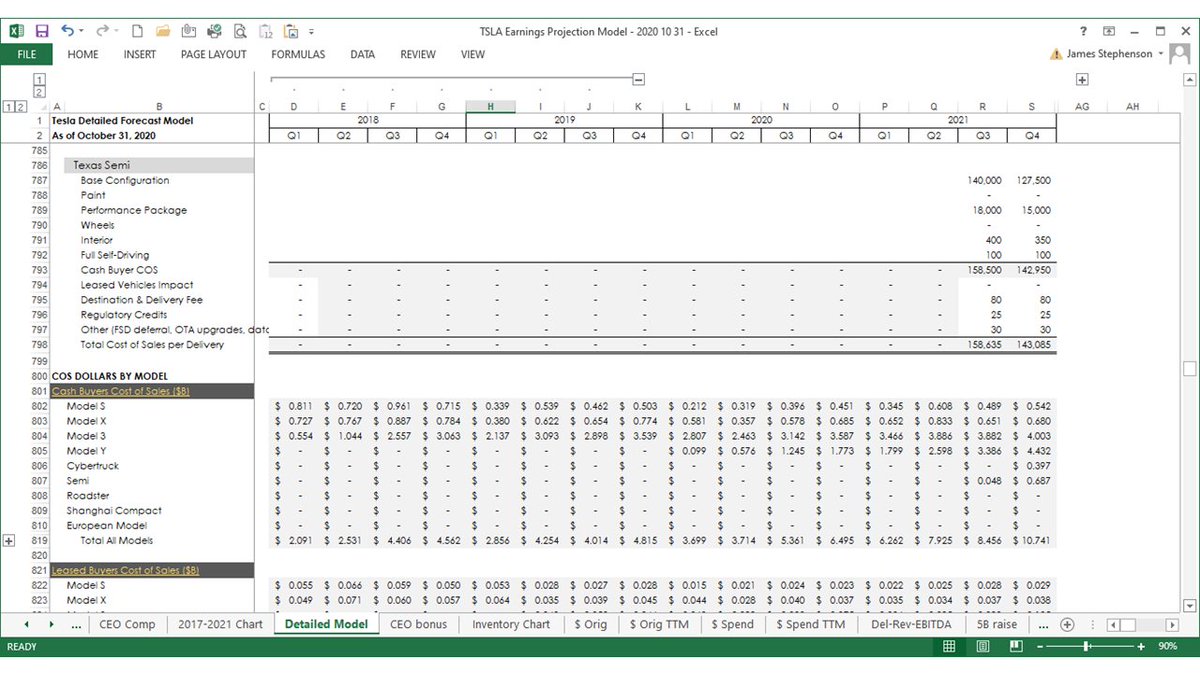
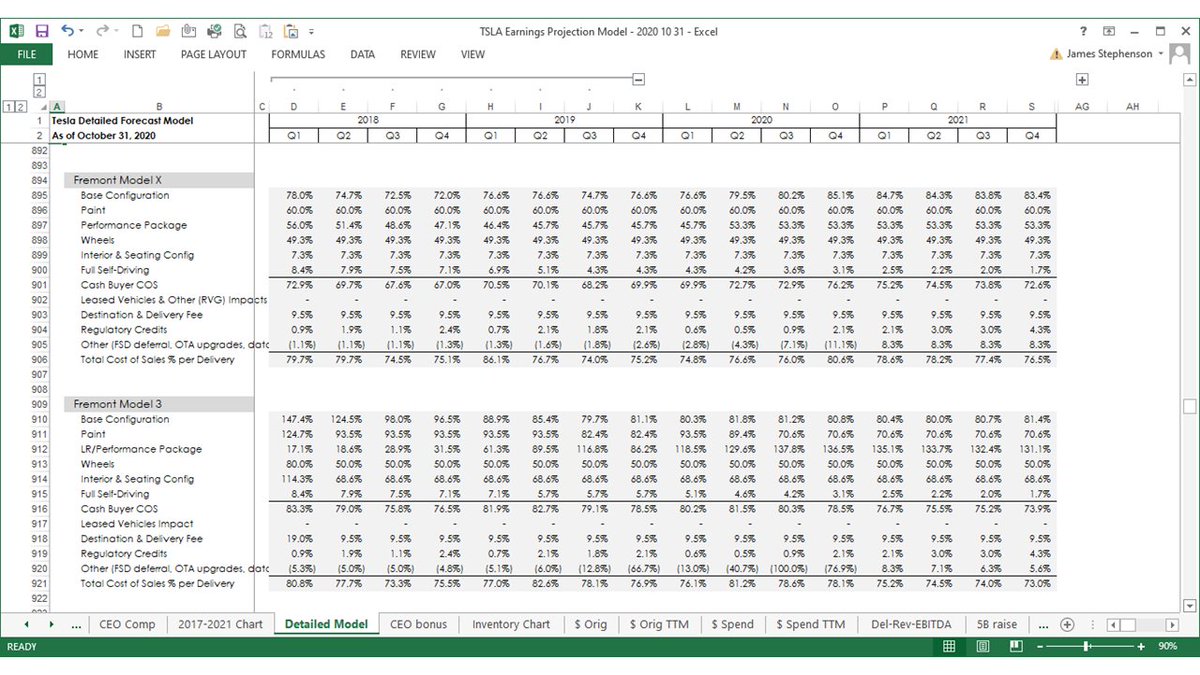
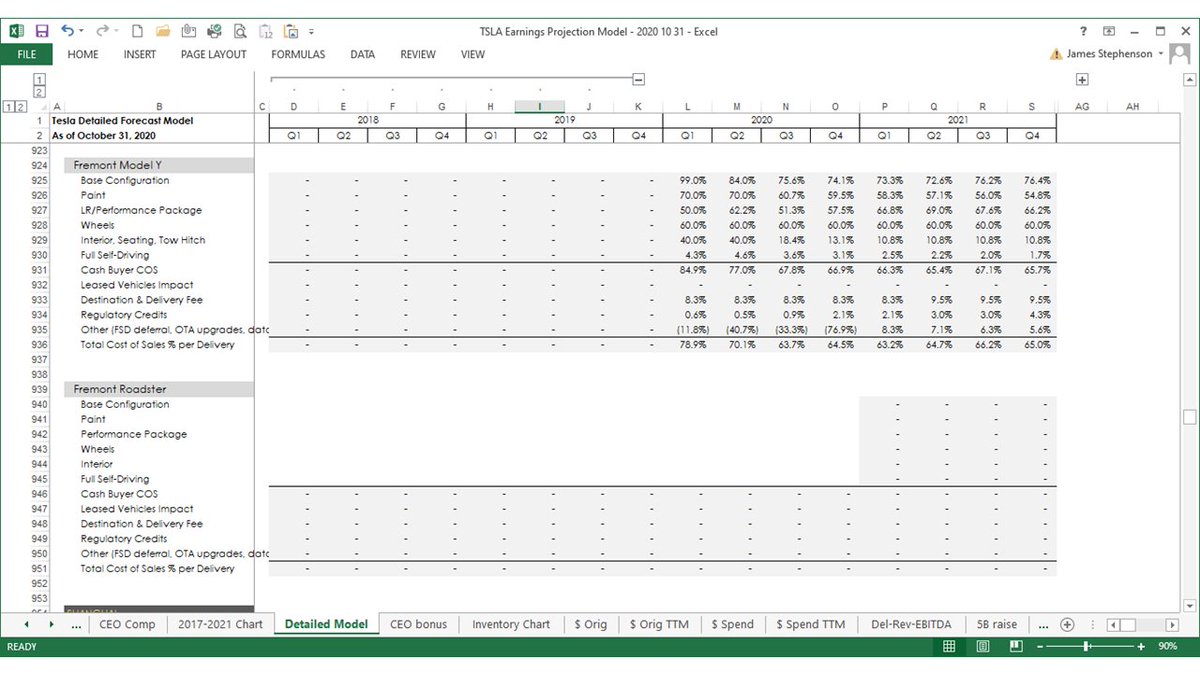
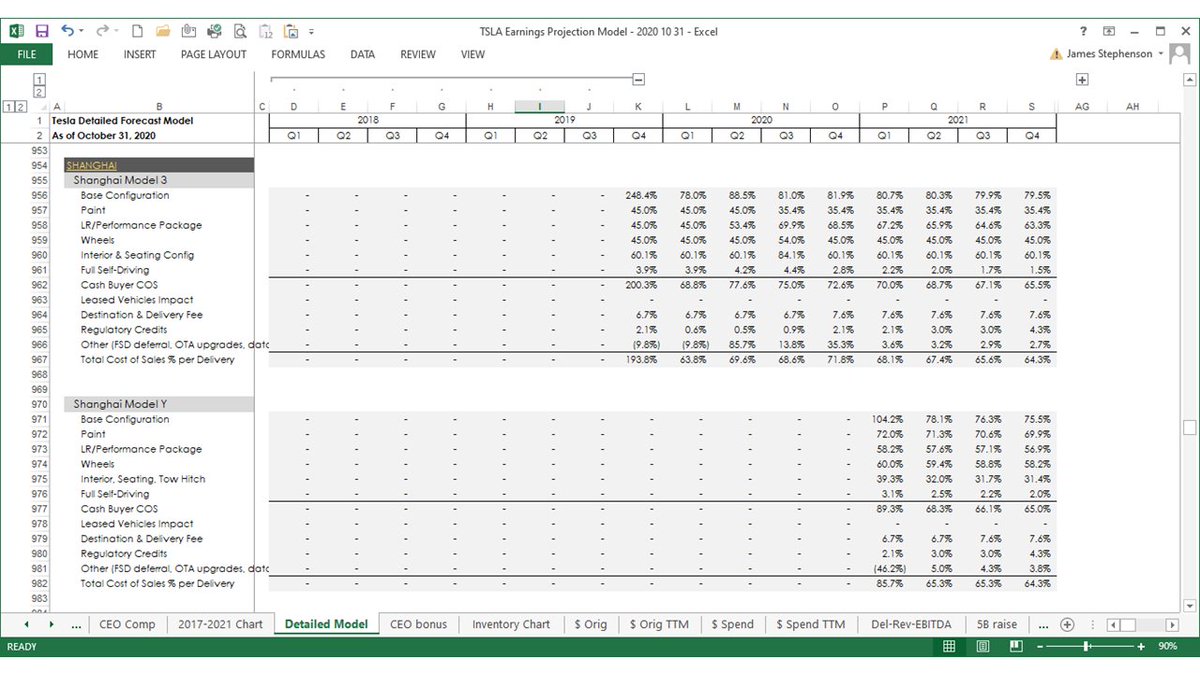
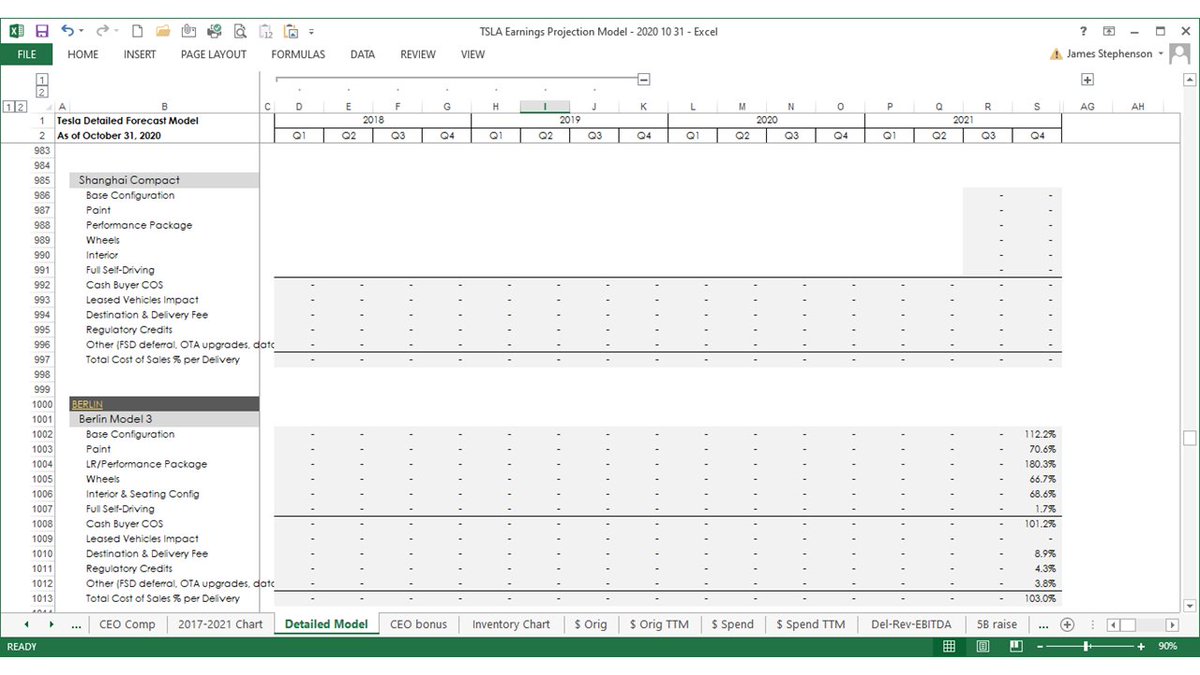
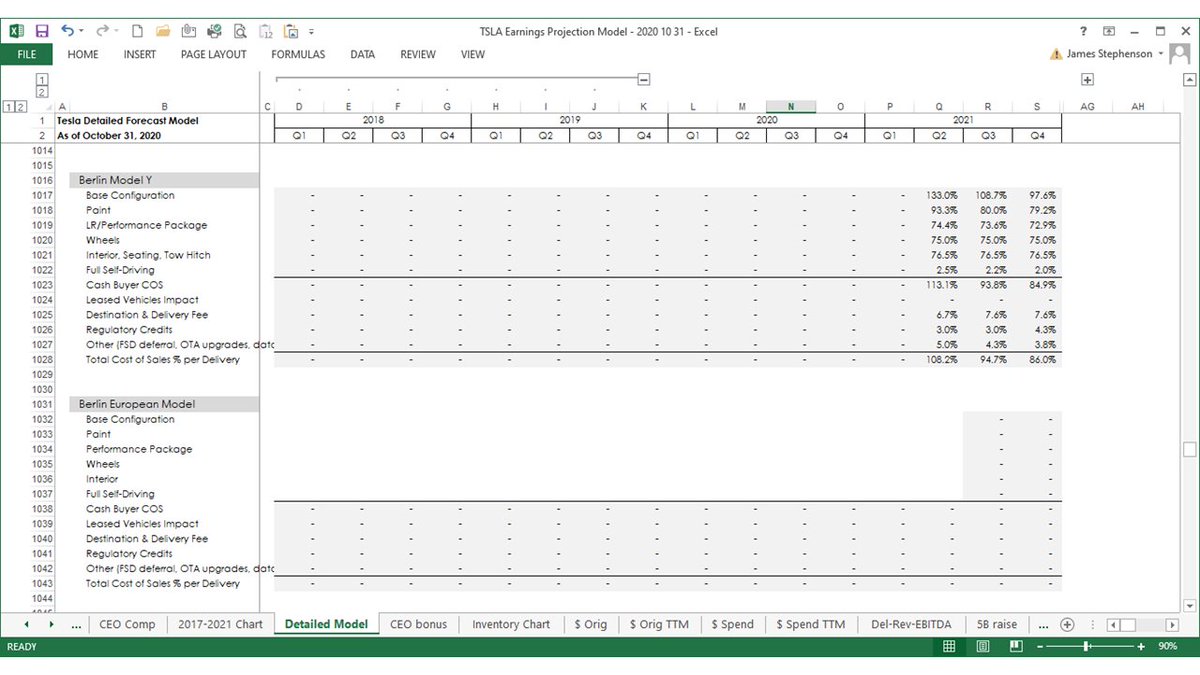
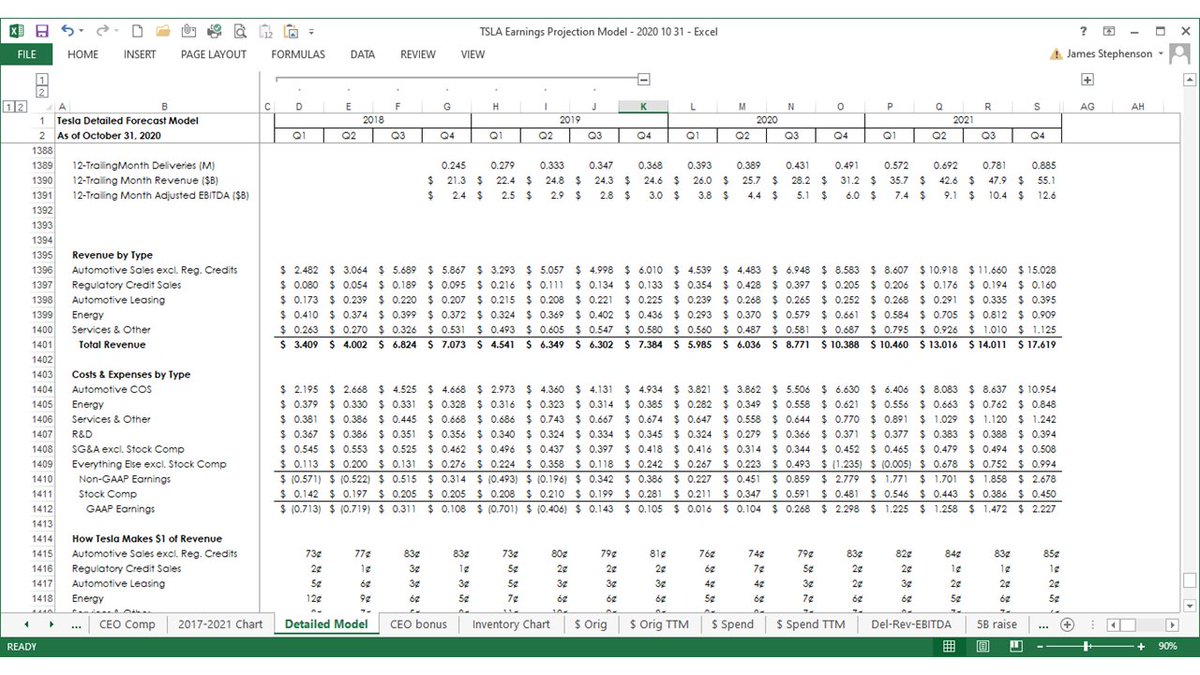
The next 48 slides over 12 tweets will show my detailed forecast model. The 4 slides at the top of this thread are just the summary tab.
Detailed forecast model slides 1-4:
Detailed forecast model slides 1-4:
Detailed forecast model slides 45-48:
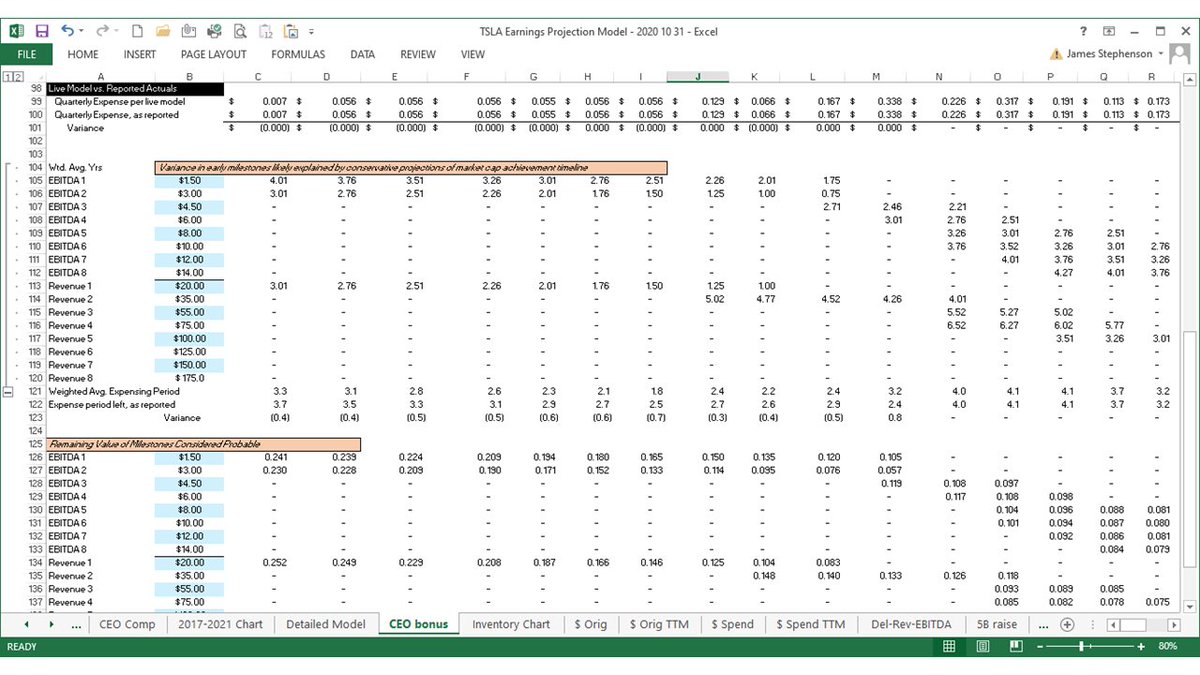
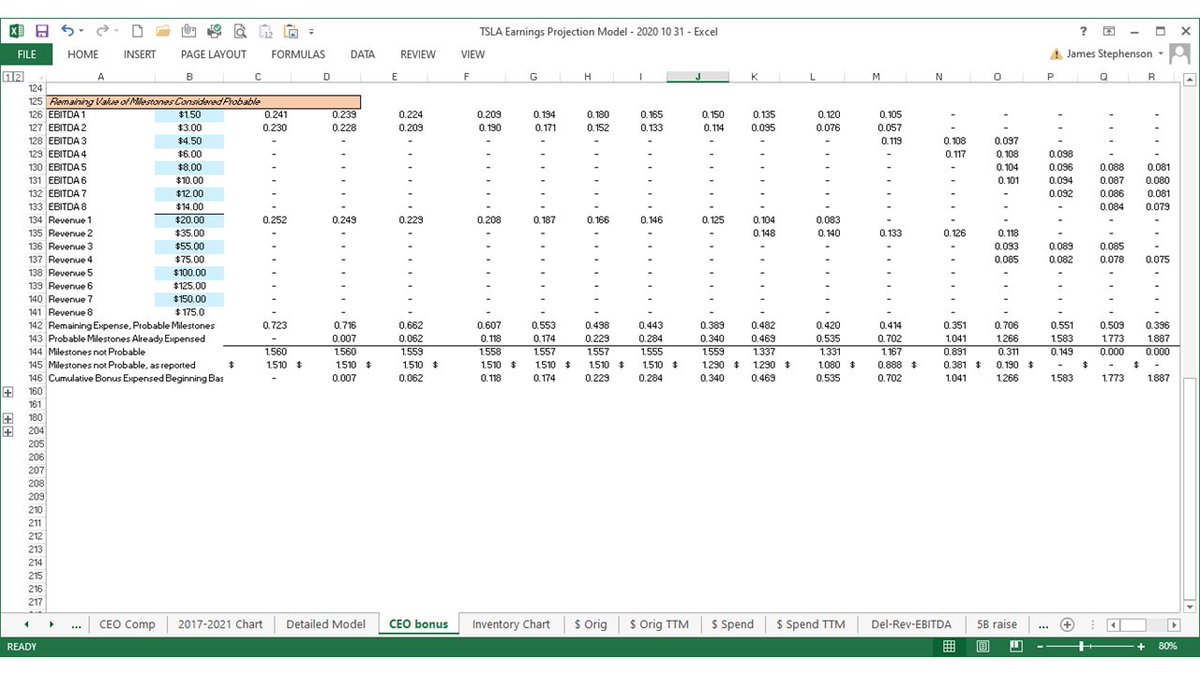
The 4th slide starts a different tab just for forecasting Elon's 2018 CEO Performance Award bonus expense. Important to note: this is a non-cash expense required by GAAP accounting. Elon actually pays Tesla when he buys the stock.
The 4th slide starts a different tab just for forecasting Elon's 2018 CEO Performance Award bonus expense. Important to note: this is a non-cash expense required by GAAP accounting. Elon actually pays Tesla when he buys the stock.
Detailed forecast model slides 49-52:
The other 4 slides for estimating Elon's SBC expense. The max expense that can be declared over the 10-yr plan is $2.283B, with about half of that expensed already.
Estimating this accurately is hard: I don't recommend anyone else try it.
The other 4 slides for estimating Elon's SBC expense. The max expense that can be declared over the 10-yr plan is $2.283B, with about half of that expensed already.
Estimating this accurately is hard: I don't recommend anyone else try it.
... and I had to add one more slide, because how ashamed would Elon be of me if I tweeted a *68-slide* deck?
4 slides of summary +
12 slides of charts +
52 slides of detail =
68
So I decided to show 1 more: the data table for the production, deliveries, and inventory chart.
4 slides of summary +
12 slides of charts +
52 slides of detail =
68
So I decided to show 1 more: the data table for the production, deliveries, and inventory chart.


 Read on Twitter
