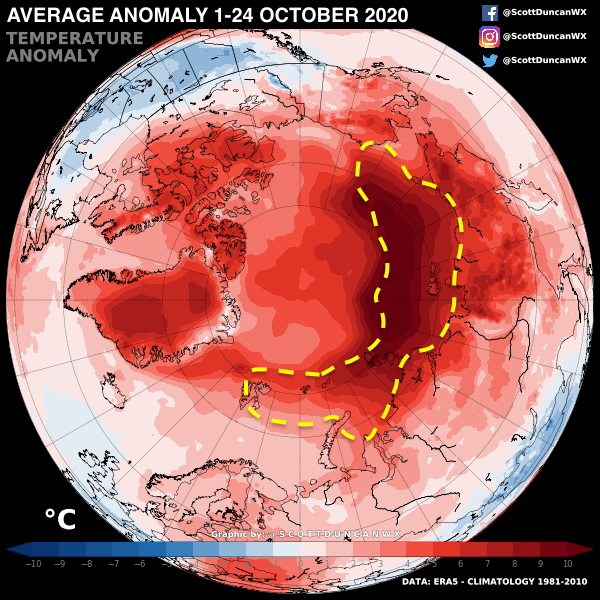
While large parts of the Arctic remain ice free, temperatures remain extremely high compared to normal for this time of year.
Temperature is unable to drop much below freezing where open water remains. In the past, ice cover would allow temperatures to be more like -25 °C.
Temperature is unable to drop much below freezing where open water remains. In the past, ice cover would allow temperatures to be more like -25 °C.
We are observing the vicious loop which amplifies climate change in the Arctic.
Warmer Arctic = more ice melt = more open water = more energy absorbed from sun in summer = warmer water = more ice melt = more open water...
Warmer Arctic = more ice melt = more open water = more energy absorbed from sun in summer = warmer water = more ice melt = more open water...
More on the Arctic sea ice trends in a thread here  https://twitter.com/ScottDuncanWX/status/1321847252093181952
 https://twitter.com/ScottDuncanWX/status/1321847252093181952
It is very important to understand what an anomaly map is. The red colour does not necessarily represent temperature above freezing. It can be -10 °C but still be +20 °C warmer than normal!
The anomaly map takes the current temperature and compared it to a 30 year average.
The anomaly map takes the current temperature and compared it to a 30 year average.

 Read on Twitter


