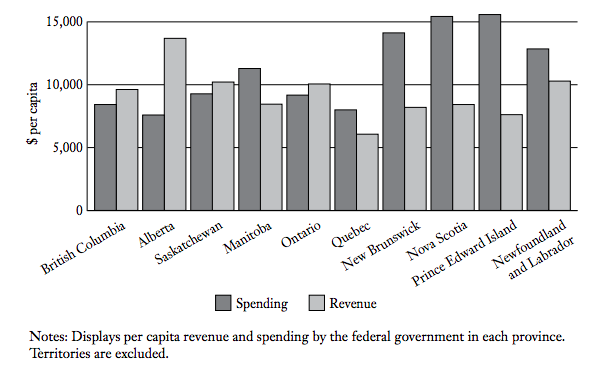
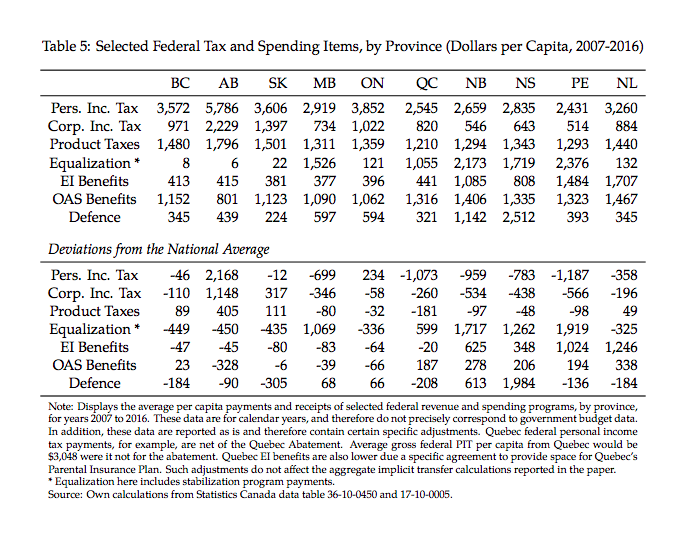
Interesting chart showing federal spending vs. revenue by province. In 2016 NL received about $2500 per capita more from Ottawa than we sent. EI being the biggest contribution to that, also OAS and below average tax revenue per capita. #nlpoli https://www.trevortombe.com/files/tombe_final_unalterable_2019.pdf
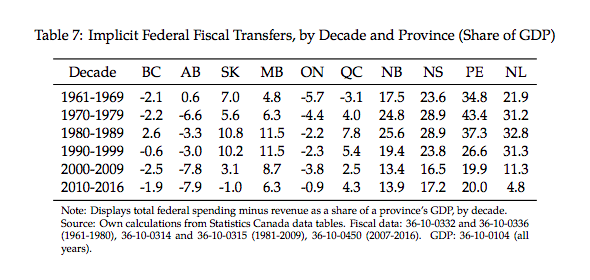
Implicit Federal Fiscal transfers used to be a third of GDP in NL. That fell to 5% during 2010-2016 as we became a "have province". #nlpoli
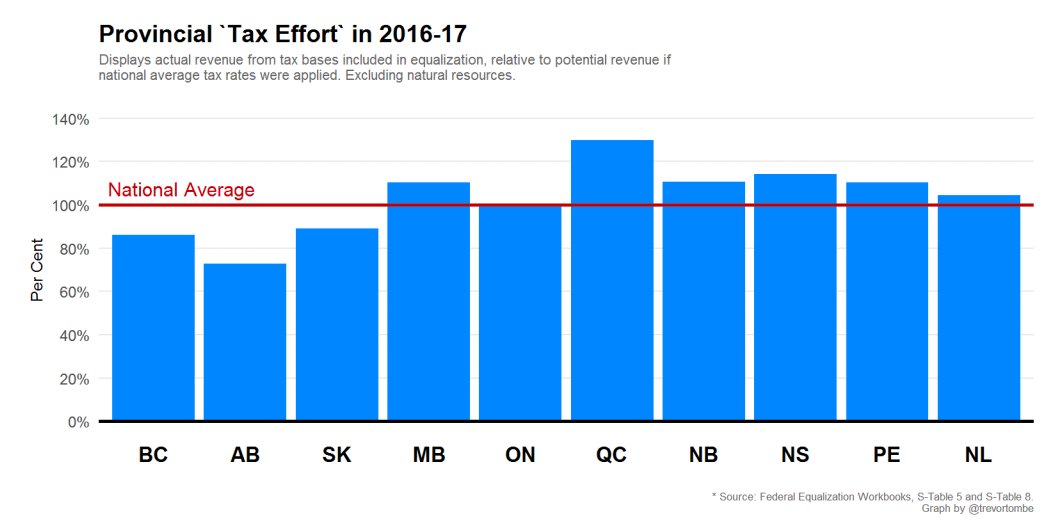
This chart show "tax effort" which is a measure of how high our taxes are relative to an "average" provincial tax regime. We seem a bit below the median of the six small provinces. I'm not sure if this accounts for Budget 2016, but I think it might? cc: @CB_Economist
Previous chart from here: https://www.policyschool.ca/unpacking-canadas-equalization-payments-2018-19/

 Read on Twitter


