Memphis/Shelby County
Covid Wk-In-Review
tl;dr
* 7-day avg: 118 daily cases, 1139 tests, 10.4%+
* cases down 6% over 1wk, 34% over 2wks
* but tests down 6% and 34% too
* so %+ has been flat for 4wks
* also, lowest testing since April!
* and more deception from the mayor
1/
Covid Wk-In-Review
tl;dr
* 7-day avg: 118 daily cases, 1139 tests, 10.4%+
* cases down 6% over 1wk, 34% over 2wks
* but tests down 6% and 34% too
* so %+ has been flat for 4wks
* also, lowest testing since April!
* and more deception from the mayor
1/
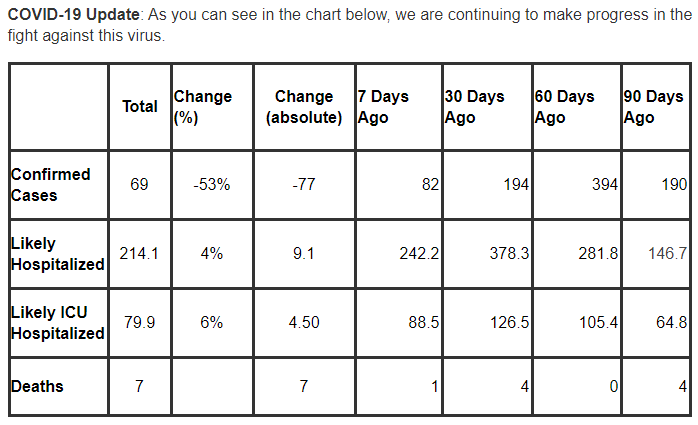
I want to start with this table that @MayorMemphis included in his update yesterday because there are so many things problematic here.
I'll try to correct it.
And then I'll provide the rest of the data.
2/
I'll try to correct it.
And then I'll provide the rest of the data.
2/
So, first of all, the data are not clearly labeled. So the 69 total cases, what is that?
Well, it's the number of cases from Wed, 9/9.
And that raises several questions, the first being, why would they use a single-day count rather than a rolling average?
3/
Well, it's the number of cases from Wed, 9/9.
And that raises several questions, the first being, why would they use a single-day count rather than a rolling average?
3/
Also why would they use the Wed count in the Fri afternoon report? Why not use the Fri count? (Or even the Th count, if it was written the day before?)
It turns out that 9/9 was an outlier day, the lowest single day in about 12wks, much lower than the avg daily case count.
4/
It turns out that 9/9 was an outlier day, the lowest single day in about 12wks, much lower than the avg daily case count.
4/
Moreover, 9/9 had a mere 121 tests reported, the single-lowest number of tests on record.
Ever.
In fact, you have to go back to April to find a day with fewer than 600 tests. And only 2 other days, 3/31 & 4/3, even have fewer than 300 tests.
It's a complete outlier.
5/
Ever.
In fact, you have to go back to April to find a day with fewer than 600 tests. And only 2 other days, 3/31 & 4/3, even have fewer than 300 tests.
It's a complete outlier.
5/
The only thing to conclude is that the mayor's team used single-day outlier data to tell a false story.
This is important. They didn't falsify the data. The numbers they cite are accurate.
But they used the data to tell an incomplete and misleading story about covid cases.
6/
This is important. They didn't falsify the data. The numbers they cite are accurate.
But they used the data to tell an incomplete and misleading story about covid cases.
6/
Here's a quick edit to the mayor's table that tells a more accurate story.
The first thing to note is that I use a 7-day avg, not daily counts.
The next thing to note is that I include the test data, bc that gives context to the case counts.
I also have clear labels.
7/
The first thing to note is that I use a 7-day avg, not daily counts.
The next thing to note is that I include the test data, bc that gives context to the case counts.
I also have clear labels.
7/
In case you're wondering, I chose to use 4wk, 8wk, and 12wk - rather than 30day, 60day, and 90day - because we know the data fluctuates according to day of the wk.
For example, there are fewer tests on the weekends.
So I chose to keep the day of the wk stable at Wednesday.
8/
For example, there are fewer tests on the weekends.
So I chose to keep the day of the wk stable at Wednesday.
8/
So what story does my edited table tell?
First, cases are down significantly over the past 8 wks. Testing is also down, but cases are down more. And so tests per case is up.
That's still a positive story, one that fits the mayor's agenda.
So why tell a false story?
9/
First, cases are down significantly over the past 8 wks. Testing is also down, but cases are down more. And so tests per case is up.
That's still a positive story, one that fits the mayor's agenda.
So why tell a false story?
9/
I don't know what else to say except that the mayor is clearly running the Trump playbook.
Exaggerate the data to tell the PR story you want, push for the actions you want - rather than using the data to accurately describe our current situation and to inform our actions.
10/
Exaggerate the data to tell the PR story you want, push for the actions you want - rather than using the data to accurately describe our current situation and to inform our actions.
10/
The other thing to note here is that the 12-wk data (roughly the mayor's 90 days) tell a different story.
The story there is that testing is down more than cases over that time, so you see a drop in tests per case.
And that's a real problem the mayor wants to hide.
11/
The story there is that testing is down more than cases over that time, so you see a drop in tests per case.
And that's a real problem the mayor wants to hide.
11/
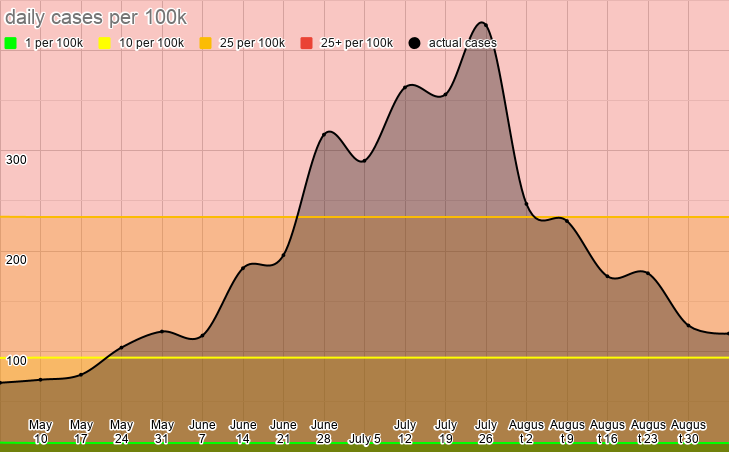
As you can see here, the case rate really has fallen significantly.
We hit a peak of 45.3 avg daily cases per 100k the week of July26.
We're down to 12.6 per 100k this week.
Still not under the 10 per 100k bar we need, but a huge drop in cases.
12/
We hit a peak of 45.3 avg daily cases per 100k the week of July26.
We're down to 12.6 per 100k this week.
Still not under the 10 per 100k bar we need, but a huge drop in cases.
12/
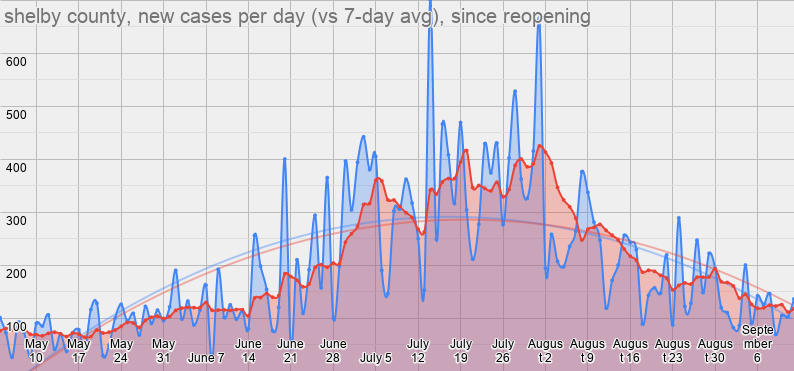
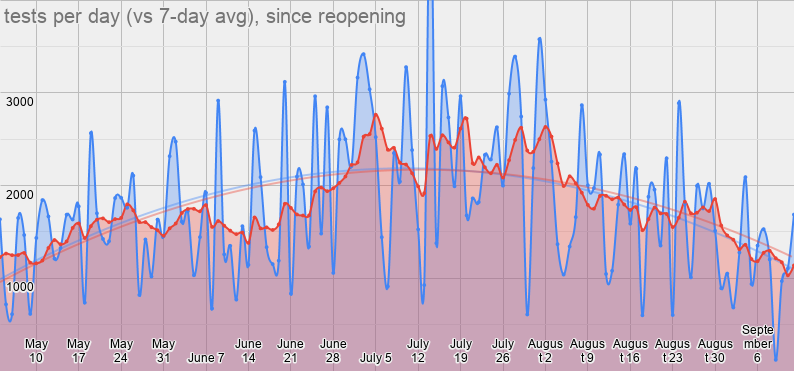
And here are daily cases.
You can see a huge drop throughout most of Aug, then a tick back up slightly, followed by another drop at the beginning of Sept.
And now we've plateaued again over the past wk.
We started the week at 119/day on Sun and are at 118/day today, Sat.
13/
You can see a huge drop throughout most of Aug, then a tick back up slightly, followed by another drop at the beginning of Sept.
And now we've plateaued again over the past wk.
We started the week at 119/day on Sun and are at 118/day today, Sat.
13/
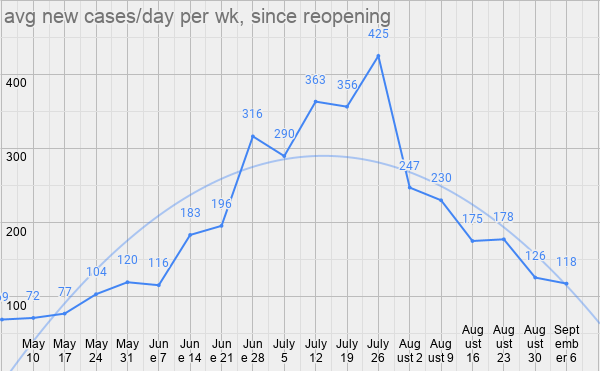
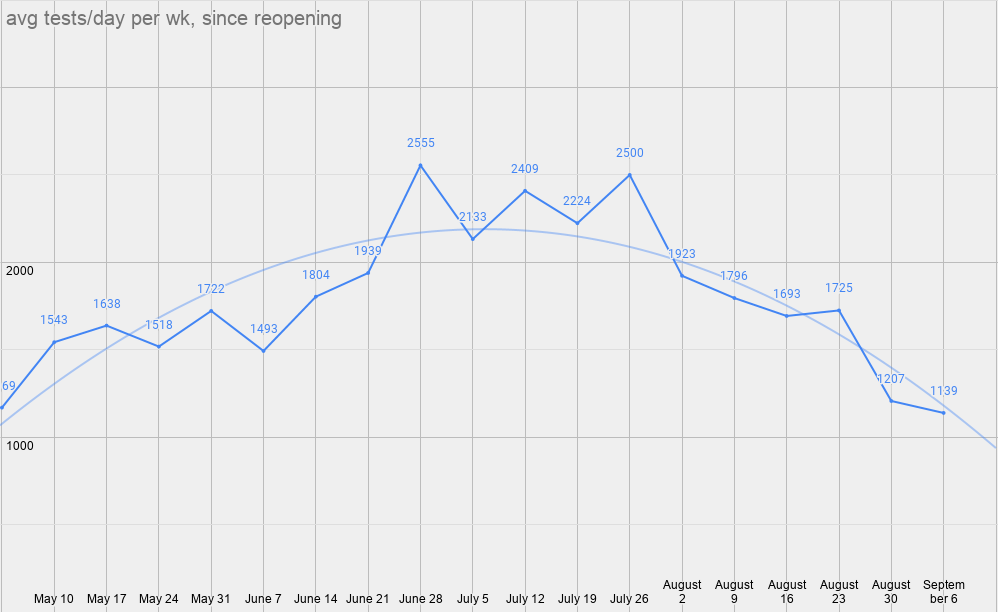
Here are avg daily cases by week.
At 118 daily cases this past week, we're at the same levels we were at in the second week in June.
That's good, right?
14/
At 118 daily cases this past week, we're at the same levels we were at in the second week in June.
That's good, right?
14/
Well, yes, until you look at tests.
At 1139 tests/day this week, we're at our lowest testing output since before we reopened the first week of May.
You have to go back to the week of Apr19 to find a week with fewer tests than we had this week.
That's a disaster!
15/
At 1139 tests/day this week, we're at our lowest testing output since before we reopened the first week of May.
You have to go back to the week of Apr19 to find a week with fewer tests than we had this week.
That's a disaster!
15/
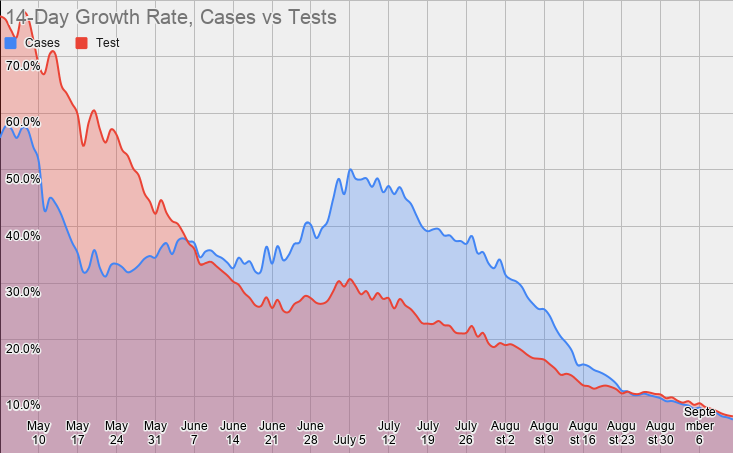
Here's the problem we're looking at.
The growth rate for cases (blue) is now following the rate for tests (red).
Essentially, this tells us that the spread is not decreasing, but our testing is limiting our ability to find cases.
In other words, we're missing cases.
16/
The growth rate for cases (blue) is now following the rate for tests (red).
Essentially, this tells us that the spread is not decreasing, but our testing is limiting our ability to find cases.
In other words, we're missing cases.
16/
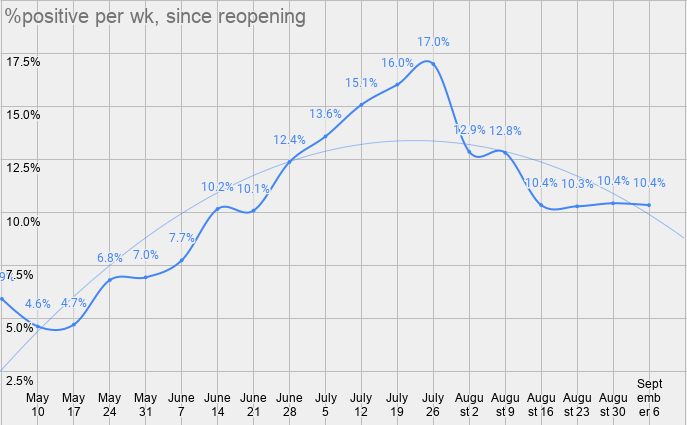
The result of case growth and test growth being equal is that the positivity rate has stayed flat, just over 10%, for a month now.
And we know that anything over 10%+ means we're missing a lot of cases.
/17
And we know that anything over 10%+ means we're missing a lot of cases.
/17
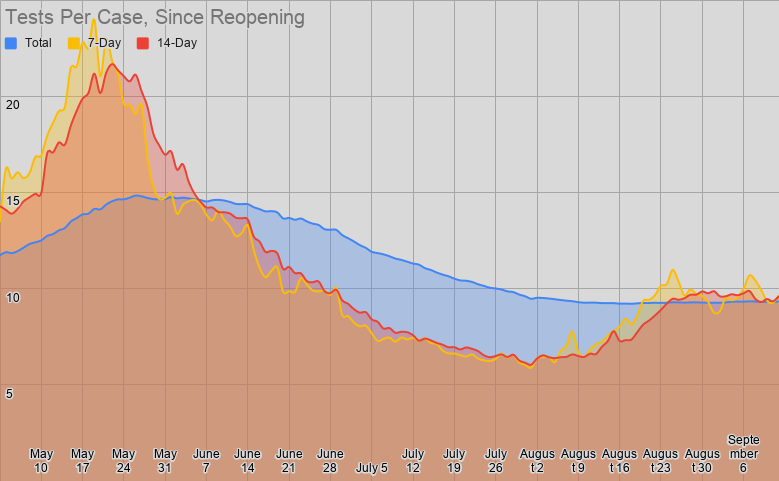
The inverse of positivity rate (which is cases per test) is tests per case.
And we've been stuck at just under 10 tests per case for a month. We're currently avg'ing 9.7 tests per case.
That's not good.
It's nearly half the national average of 19.1 tests per case.
18/
And we've been stuck at just under 10 tests per case for a month. We're currently avg'ing 9.7 tests per case.
That's not good.
It's nearly half the national average of 19.1 tests per case.
18/
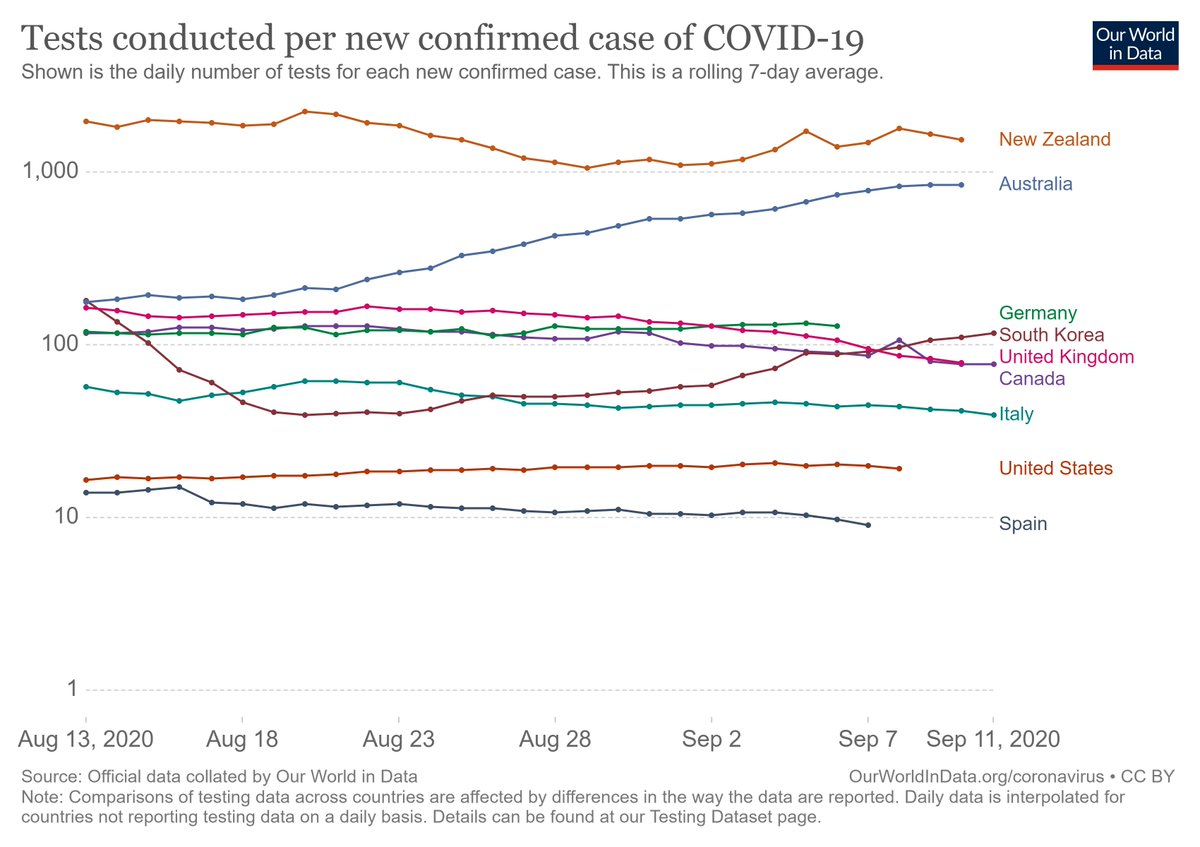
Italy's doing 39 tests per case.
Canada's at 77.
The UK is at 79.
South Korea's at 116.
Germany's at 128.
Australia's at 846.
New Zeland is at 1528.
Meanwhile, the US is at 19.
And Memphis is at a mere 9.7 tests per case.
This continues to be a huge problem.
19/
Canada's at 77.
The UK is at 79.
South Korea's at 116.
Germany's at 128.
Australia's at 846.
New Zeland is at 1528.
Meanwhile, the US is at 19.
And Memphis is at a mere 9.7 tests per case.
This continues to be a huge problem.
19/
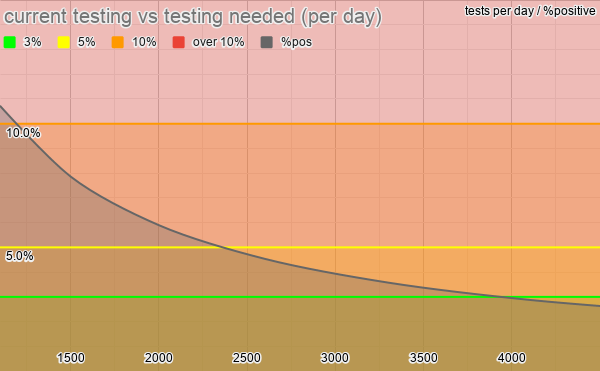
So how many tests should we be doing?
We're avg'ing 118 daily cases, with 1139 daily tests, at 10.4%+.
To get under 5%, we'd need 2400 tests/day. That's more than double our current testing.
To get under 3%, we'd need 4100 tests/day, or 3.6x more.
20/
We're avg'ing 118 daily cases, with 1139 daily tests, at 10.4%+.
To get under 5%, we'd need 2400 tests/day. That's more than double our current testing.
To get under 3%, we'd need 4100 tests/day, or 3.6x more.
20/
In the past 1wk...
cases are down 6%
& testing is down 6%.
Over 2wks...
cases are down 34%
& testing is down 34%.
Since wk of July4...
cases are down 63%
& testing is down 55%.
Since wk of Phase2...
cases are *up* 52%
but testing is down 30%.
21/
cases are down 6%
& testing is down 6%.
Over 2wks...
cases are down 34%
& testing is down 34%.
Since wk of July4...
cases are down 63%
& testing is down 55%.
Since wk of Phase2...
cases are *up* 52%
but testing is down 30%.
21/
We're 6 months into this pandemic.
And we're down to the same levels of testing as we were in the 2nd month!
Testing remains a complete failure.
But it's a failure our leaders won't acknowledge.
22/
And we're down to the same levels of testing as we were in the 2nd month!
Testing remains a complete failure.
But it's a failure our leaders won't acknowledge.
22/
Some say we have "plenty" of testing, the problem is just that ppl aren't getting tested.
One, define "plenty" for me.
Can we do 2500/day?
Because even at our peak, we couldn't sustain 2500 tests/day. In July, we only hit that bar 2 of 5 wks (June28-July4 & July26-Aug1).
23/
One, define "plenty" for me.
Can we do 2500/day?
Because even at our peak, we couldn't sustain 2500 tests/day. In July, we only hit that bar 2 of 5 wks (June28-July4 & July26-Aug1).
23/
Two, why aren't ppl seeking testing?
Maybe it's bc they lost faith in testing after the utter failure that was July.
And so maybe we should try to restore that faith.
24/
Maybe it's bc they lost faith in testing after the utter failure that was July.
And so maybe we should try to restore that faith.
24/
Maybe it's bc they were told that testing was only available for those with symptoms or known exposures.
And so maybe we should run a campaign telling ppl to get tested wkly.
What, that would require more tests than we have? Yeah, so then we don't have "plenty" of testing.
25/
And so maybe we should run a campaign telling ppl to get tested wkly.
What, that would require more tests than we have? Yeah, so then we don't have "plenty" of testing.
25/
One last thing.
In the covid task force briefing this week, they noted that they're seeing increased spread "outside the 240 loop." They specifically mentioned Germantown and Millington.
Now, they didn't mention schools being open, but I don't think it's a stretch.
26/
In the covid task force briefing this week, they noted that they're seeing increased spread "outside the 240 loop." They specifically mentioned Germantown and Millington.
Now, they didn't mention schools being open, but I don't think it's a stretch.
26/
And I think we should be really cautious about the next couple weeks, as we start to see the impact of Labor Day.
I'll end there.
The next couple weeks are very important.
27/27
I'll end there.
The next couple weeks are very important.
27/27

 Read on Twitter