Three days ago I posted a thread pointing out that the government was presenting lab capacity data in a misleading way, and Pillar 2 labs were probably at or near capacity.
Yesterday the government quietly released separate capacity data for each pillar which confirms this.
Yesterday the government quietly released separate capacity data for each pillar which confirms this.
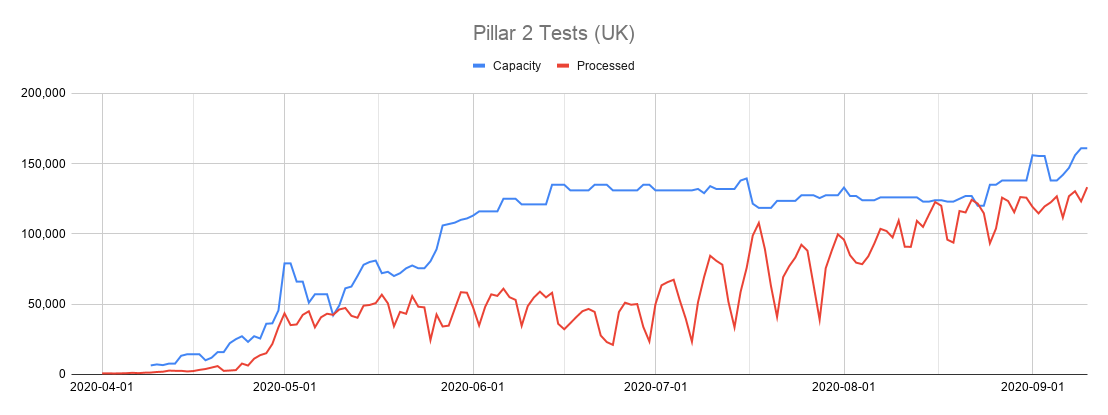
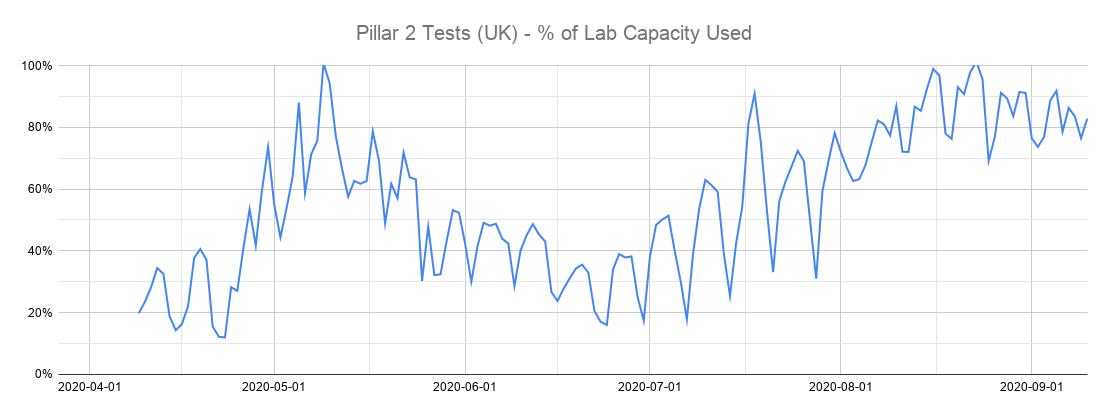
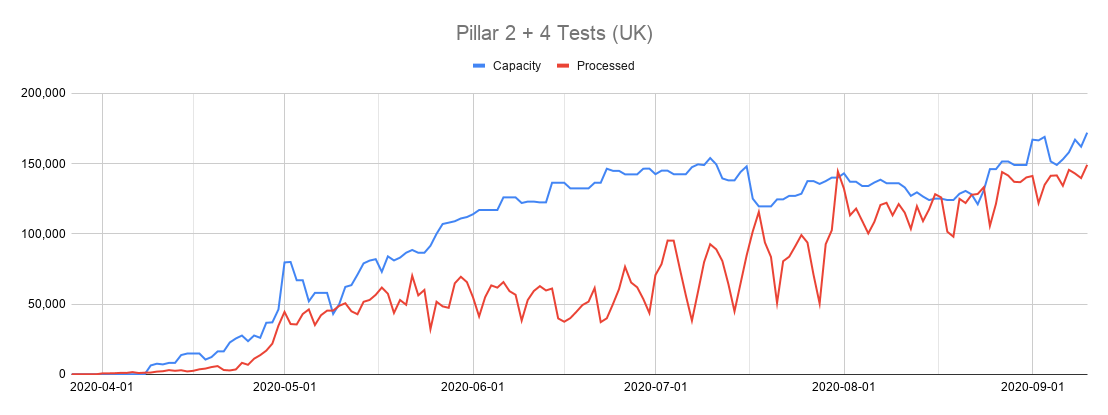
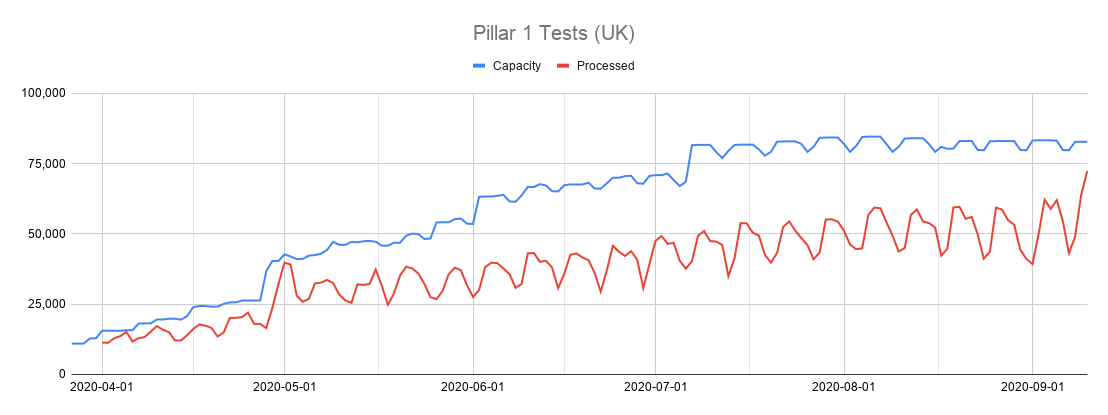
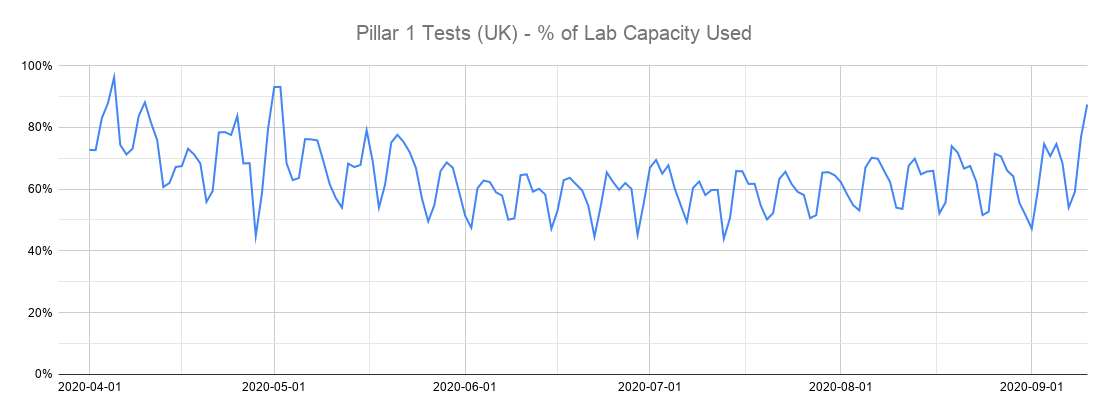
We can now see Pillar 2 labs handling community testing (drive in and mobile testing sites, home testing, the care home testing program etc) hit 100% capacity in August, and despite some new capacity being added still claim to be running at 80-90% most days.
It's actually worse.
It's actually worse.
Because Pillar 2 labs also process some Pillar 4 tests.
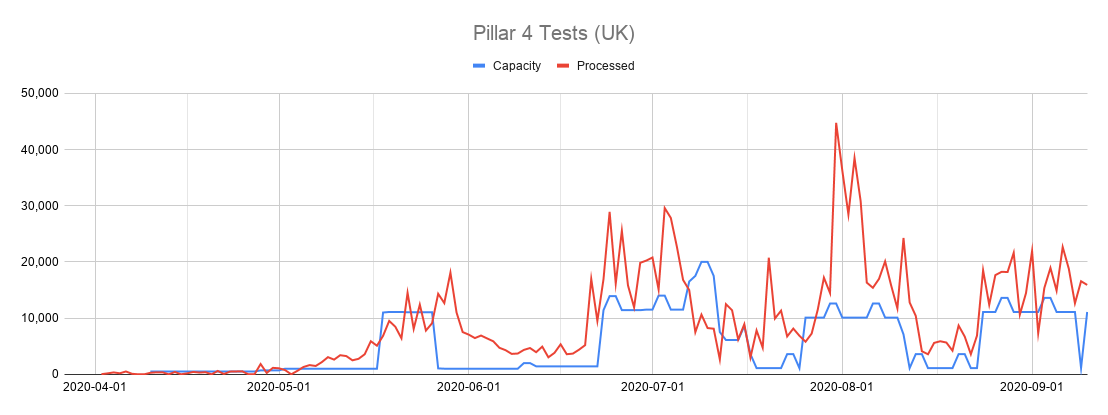
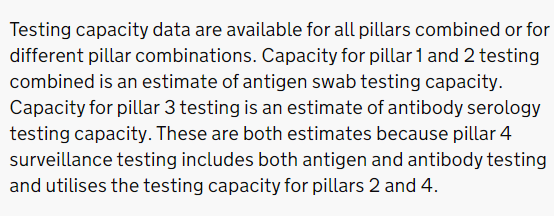
This is confirmed in the dashboard notes, and you can see from the data that thousands more Pillar 4 tests are being processed every day than dedicated Pillar 4 labs (possibly handling specific studies?) have capacity for.
This is confirmed in the dashboard notes, and you can see from the data that thousands more Pillar 4 tests are being processed every day than dedicated Pillar 4 labs (possibly handling specific studies?) have capacity for.
If we combine pillar 2 and 4 data (which may still be generous, as it's not clear if all dedicated pillar 4 lab capacity is actually being used), we can see it's been running at an average of 90% capacity for the last week.
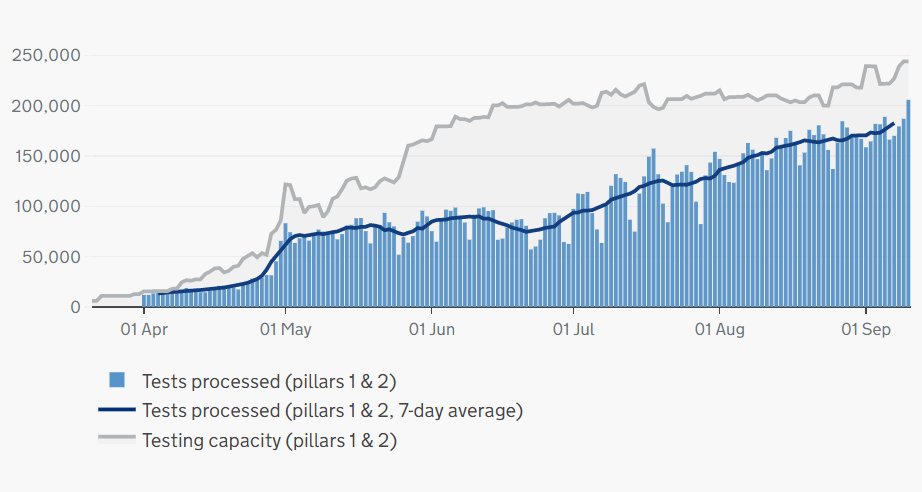
None of this is apparent on the dashboard though.
Because they've chosen to combine Pillar 1 (NHS/PHE lab) and Pillar 2 (Lighthouse/commercial lab) capacity instead.
I've not seen any evidence yet that there's any cross over between these two sets of labs and testing programs.
Because they've chosen to combine Pillar 1 (NHS/PHE lab) and Pillar 2 (Lighthouse/commercial lab) capacity instead.
I've not seen any evidence yet that there's any cross over between these two sets of labs and testing programs.
Doing this makes thins look better than they really are.
Because Pillar 1 has spare capacity which probably isn't available to handle excess Pillar 2 tests (certainly it wasn't in the past).
But Pillar 4 (not included on the dashboard) definitely does use Pillar 2 lab capacity.
Because Pillar 1 has spare capacity which probably isn't available to handle excess Pillar 2 tests (certainly it wasn't in the past).
But Pillar 4 (not included on the dashboard) definitely does use Pillar 2 lab capacity.
And capacity limits are causing real issues.
The government is rationing access to Pillar 2 tests to stop labs being overwhelmed, leaving people unable to book tests or having to travel hundreds of miles, despite local test sites being almost abandoned. https://twitter.com/_johnbye/status/1301639568907735040?s=20
The government is rationing access to Pillar 2 tests to stop labs being overwhelmed, leaving people unable to book tests or having to travel hundreds of miles, despite local test sites being almost abandoned. https://twitter.com/_johnbye/status/1301639568907735040?s=20
Meanwhile the care home testing program has finally managed to retest all care homes for the elderly for the first time since June. But homes still report issues getting tested regularly and delays getting results that sometimes void their tests entirely. https://twitter.com/_johnbye/status/1303234079341588480?s=20
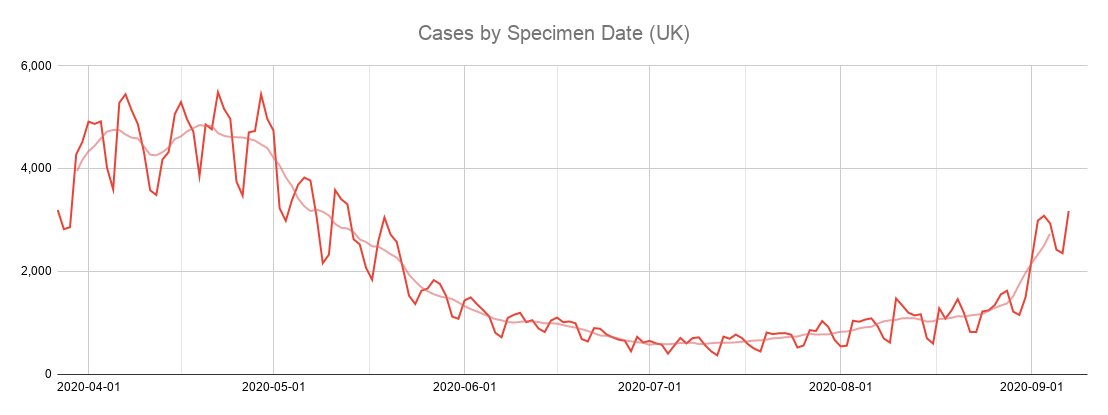
All of this comes against a background of rapidly rising cases across the country, the return of pupils to school, and the coming of winter colds and flu, all of which will inevitably increase demand for coronavirus testing.
Testing data can be found on the dashboard below.
The "Testing and capacity" section at the top gives lab capacity.
Clicking the icon in the top right downloads the spreadsheet breaking this down by individual pillar.
Clicking about shows the notes.
https://coronavirus.data.gov.uk/testing
The "Testing and capacity" section at the top gives lab capacity.
Clicking the icon in the top right downloads the spreadsheet breaking this down by individual pillar.
Clicking about shows the notes.
https://coronavirus.data.gov.uk/testing
And here's my thread from earlier in the week, explaining how the government was fudging the numbers to make it look like they had more capacity than they really did. https://twitter.com/_johnbye/status/1303470253838684160?s=19

 Read on Twitter