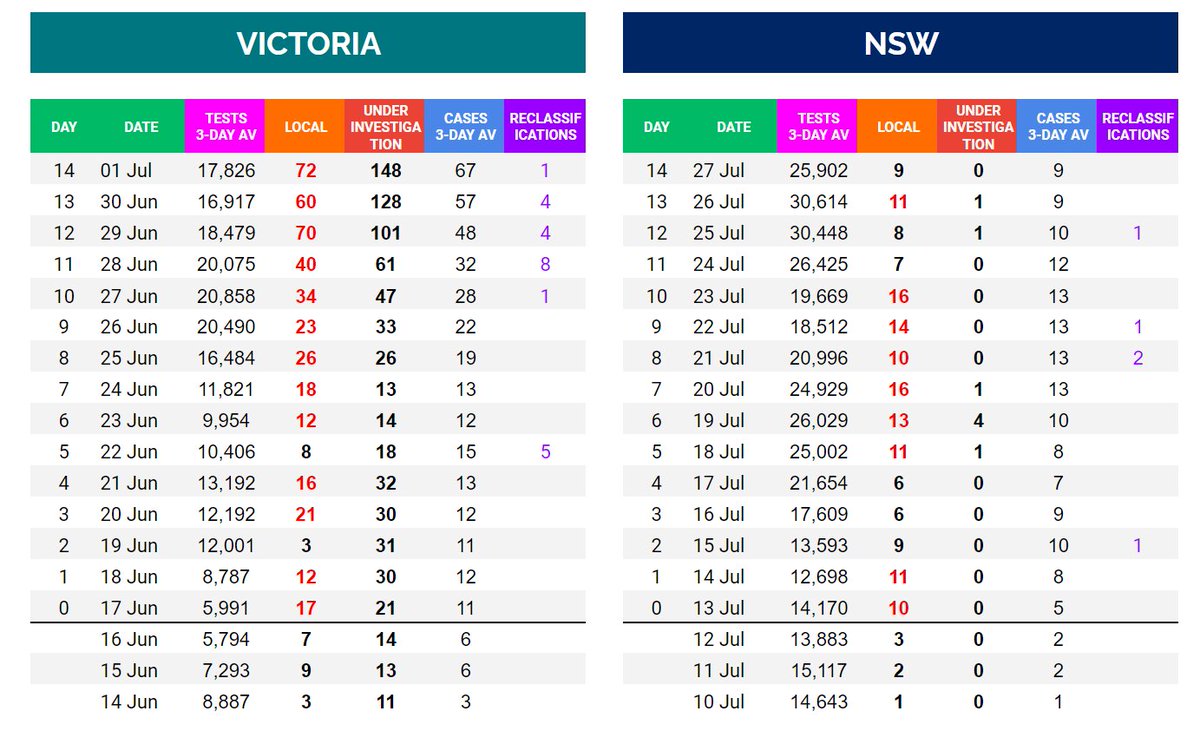
As part of @oz_f comprehensive piece on contact tracing, I did some data analysis on  VIC and
  NSW case at the beginning of their respective '2nd waves'
To measure exactly when contact tracing broke down, we must monitor the "under investigation" source of infection number
/1
 VIC and
  NSW case at the beginning of their respective '2nd waves'
To measure exactly when contact tracing broke down, we must monitor the "under investigation" source of infection number
/1
June 9th  Victoria records 0 new cases.
June 17th : Victoria records their first day of 10+ local cases. The 3-day testing avg is 5,991.
June 25 : After the *third* consecutive day of 10+ local cases, the under investigation count is 26 and continues to rise.
/2
 Victoria records 0 new cases.
 June 17th : Victoria records their first day of 10+ local cases. The 3-day testing avg is 5,991.
June 25 : After the *third* consecutive day of 10+ local cases, the under investigation count is 26 and continues to rise.
/2
It's from this point the 'under investigation' count never recovers, peaking at 3,969 on Aug 5.
While there was a massive upscale in testing at the time, it might of been too late. It wasn't until July 7 (Day 21) to average 26k tests a day.
Reclassifications also appear.
/3
While there was a massive upscale in testing at the time, it might of been too late. It wasn't until July 7 (Day 21) to average 26k tests a day.
Reclassifications also appear.
/3
July 13  NSW records 10 local cases. The 3-day testing avg is 14,170
Jul 23 : NSW manages *6* days in a row of 10+ cases. The 'under investigation' remains at 0 and the test avg close to 20k
Aug 7 : NSW manages *11* consecutive days of 10+ cases with a 25k test average
/4
 NSW records 10 local cases. The 3-day testing avg is 14,170
 Jul 23 : NSW manages *6* days in a row of 10+ cases. The 'under investigation' remains at 0 and the test avg close to 20k
Aug 7 : NSW manages *11* consecutive days of 10+ cases with a 25k test average
/4
With a much more efficient process of closing cases, and larger testing from the onset, NSW have successfully navigated the 'second wave' (for the moment).
detailed data
https://docs.google.com/spreadsheets/d/1yuvF7T-Wpdlbbo-OXKHj2jxUQ5R508uJ4n4jumQPaAY/edit#gid=0
5/5
 NSW have successfully navigated the 'second wave' (for the moment).
detailed data

https://docs.google.com/spreadsheets/d/1yuvF7T-Wpdlbbo-OXKHj2jxUQ5R508uJ4n4jumQPaAY/edit#gid=0
5/5
@oz_f piece on contact tracing in Victoria https://twitter.com/oz_f/status/1304537611621609472
I forgot to mention, it was also during this "upscale" testing that reclassifications started to appear in  Victoria
28 June : 8 reclassifications
~1368 reclassifications since 28 June (largely due to duplication)
almost the infamous *routine testing* classification
 Victoria
 28 June : 8 reclassifications
~1368 reclassifications since 28 June (largely due to duplication)
almost the infamous *routine testing* classification

 Read on Twitter


