y'all I completely forgot it was Friday so Death Day is gonna happen but it's gonna be delayed and abbreviated
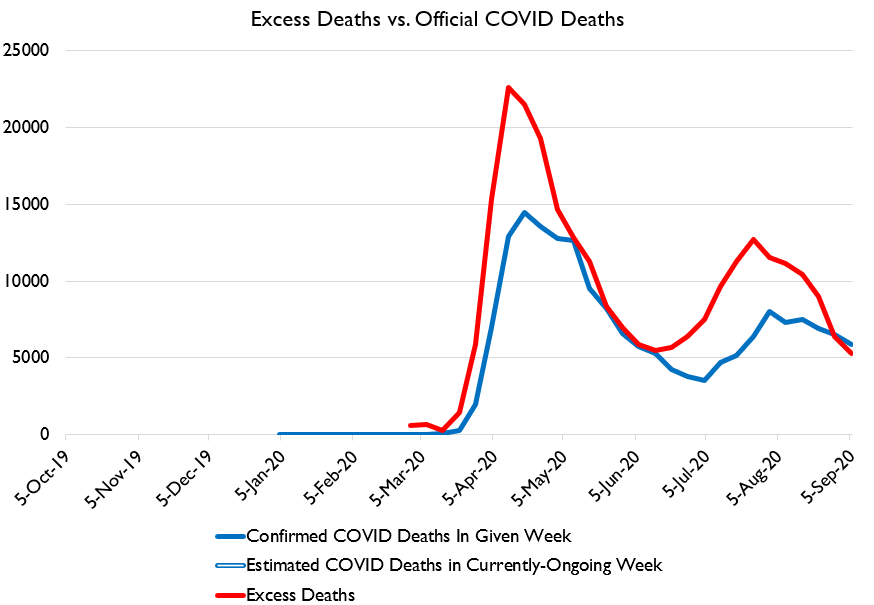
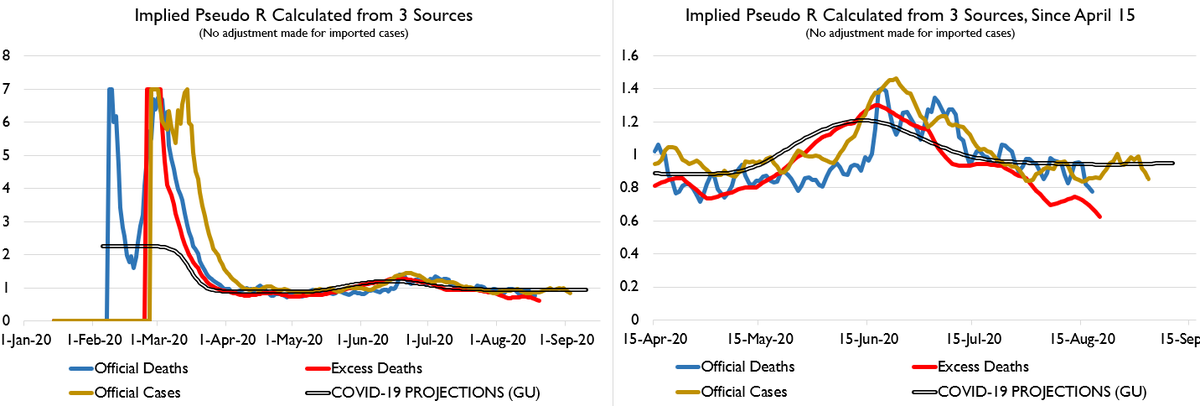
Well folks, today's death report has some good news. It really looks like we've peaked on deaths, R values are staying below 1, and ALSO I've made a calculation change that will make some people happy. True COVID deaths somewhere between 250k and 375k.
So, let's first get the method change out of the way.
I've had a lot of people be like LYMAN THERE CANNOT POSSIBLY BE 300,000 EXCESS DEATHS FROM COVID.
I've had a lot of people be like LYMAN THERE CANNOT POSSIBLY BE 300,000 EXCESS DEATHS FROM COVID.
The thing is, these folks aren't usually disputing my estimate of *total* deaths. They're not debating that total deaths in week X will be Z. They're debating how we should calculate "excess" and thus get a benchmark for COVID-19 deaths.
And the truth is, there IS ambiguity about how to do this! Some widely-used software tools set complicated statistical parameters for getting at "true excess deaths," but they are mostly concerned with flagging public health warning events, not baselining epi data.
So I've used two simple but straightforward mechanisms: estimated weekly deaths minus 1) average deaths on that week in prior years, or 2) max death on that week in prior years.
I figured, somewhere between there is a fair baseline.
I figured, somewhere between there is a fair baseline.
And broadly speaking, that's true.
But, in the course of sparring with the folks who disagreed, while I found their arguments for low excess death counts manifestly dumb, I did persuade myself that I *was* making a mistake.
But, in the course of sparring with the folks who disagreed, while I found their arguments for low excess death counts manifestly dumb, I did persuade myself that I *was* making a mistake.
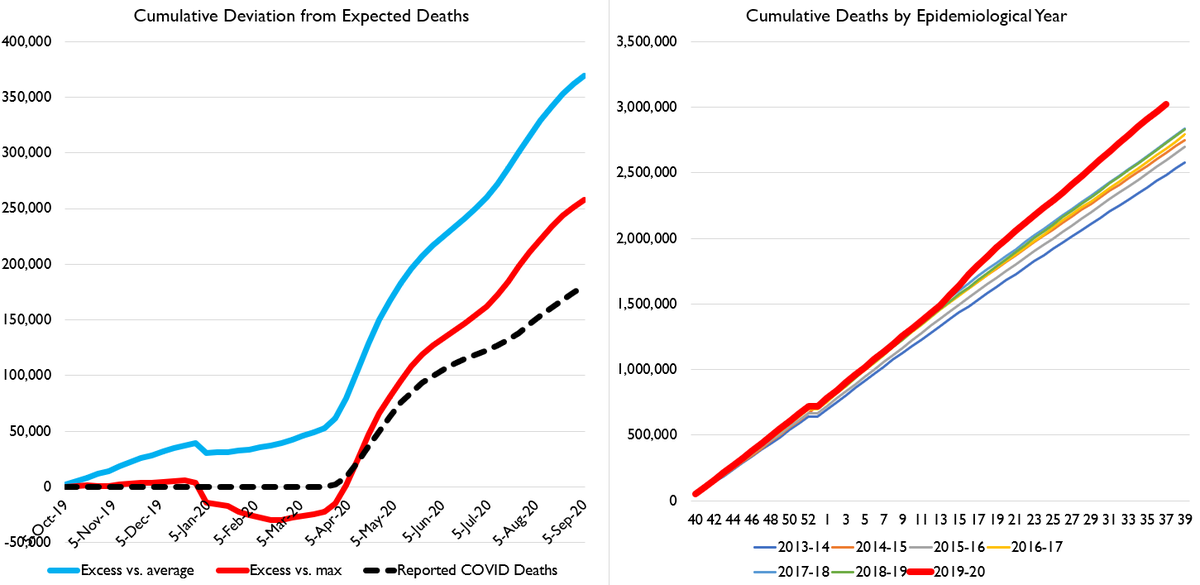
Here's weekly excess deaths using the 2 methods above, and ALSO using the two methods above *rebaselining* weekly estimated excess to the average weekly excess for the 2019 portion of this epidemiological year.
What you can see is:
1) Adjusting vs. the crude average produces MUCH higher estimates
2) ANY of the other 3 methods are effectively identical
3) All methods show a considerable UNDERCOUNT by official COVID stats
1) Adjusting vs. the crude average produces MUCH higher estimates
2) ANY of the other 3 methods are effectively identical
3) All methods show a considerable UNDERCOUNT by official COVID stats
IN THE PAST, what I used was the average of the crude average and the crude maximum.
I now believe that this method was overestimating excess deaths, *though by less than the crude average line*. It'd be between that light blue line and the other lines.
I now believe that this method was overestimating excess deaths, *though by less than the crude average line*. It'd be between that light blue line and the other lines.
NOW, I am using that same method, but with an adjustment for the early-season excess, which makes it equivalent to the 3 new clustered lines above (also, typo, I've put in 2020-21 dates there instead of 19-20, just a cosmetic issue doesn't impact calculations).
AS A RESULT, while the "crude average basis" excess deaths are still very high at around 375k, MY PREFERRED ESTIMATE is around 265k excess deaths.
This will still leave many of my critics unsatisfied, as they are convinced there's an overcount of COVID deaths. There's not. COVID deaths are undercounted. But the extent of the undercount is a bit less severe than I previously suggested.
Note that this has NO IMPACT on my US/EU comparison since, due to data constraints, they are both compared to just a crude change vs. 2019, since I that's all I have consistent data for for all regions of analysis. https://twitter.com/mdavidbrown/status/1304534257793208320
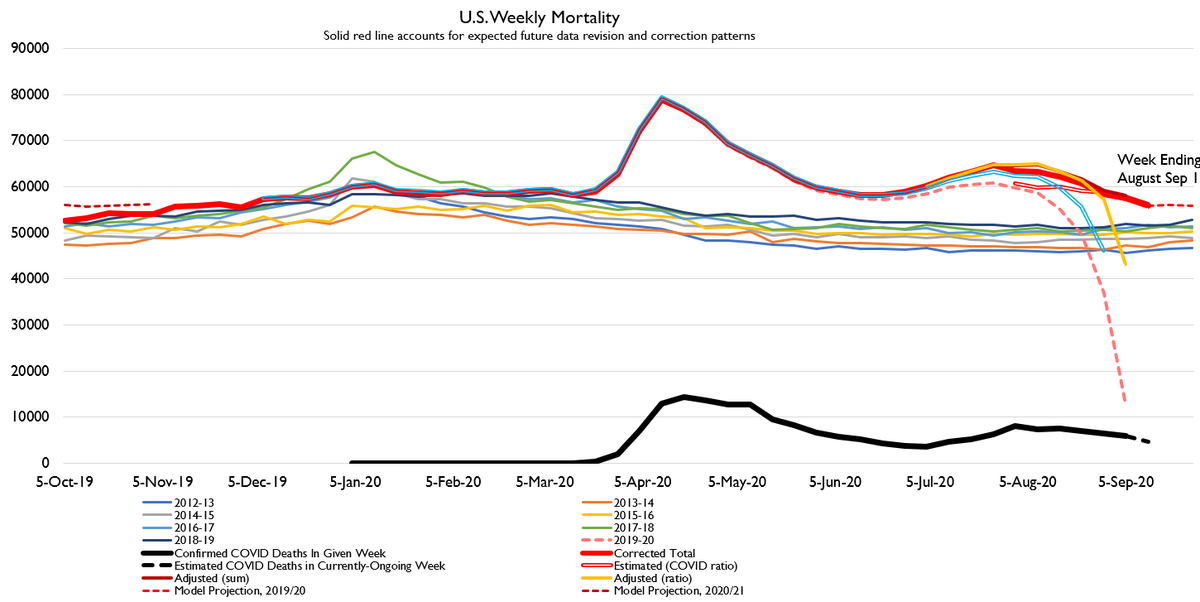
Now, method out of the way, let's talk new data. The latest week of revised data was VERY good. Pushes the estimate does considerably, including for a few back weeks. "Normal deaths by Thanksgiving" now looks very likely.
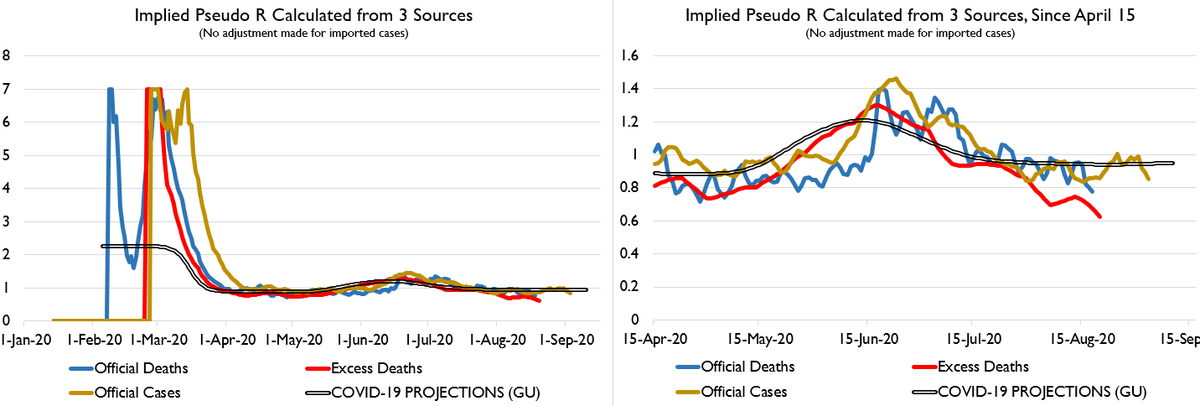
R values continue to be below 1 by all calculations. The excess-death based calculation is especially low, which is very encouraging.
I wondered if someone might ask this!
Yes. Excess deaths are NOT the maximum potential death toll. If non-COVID deaths fell in frequency then excess deaths would UNDERESTIMATE COVID deaths. https://twitter.com/michaelgoodin/status/1304535934675963907
Yes. Excess deaths are NOT the maximum potential death toll. If non-COVID deaths fell in frequency then excess deaths would UNDERESTIMATE COVID deaths. https://twitter.com/michaelgoodin/status/1304535934675963907
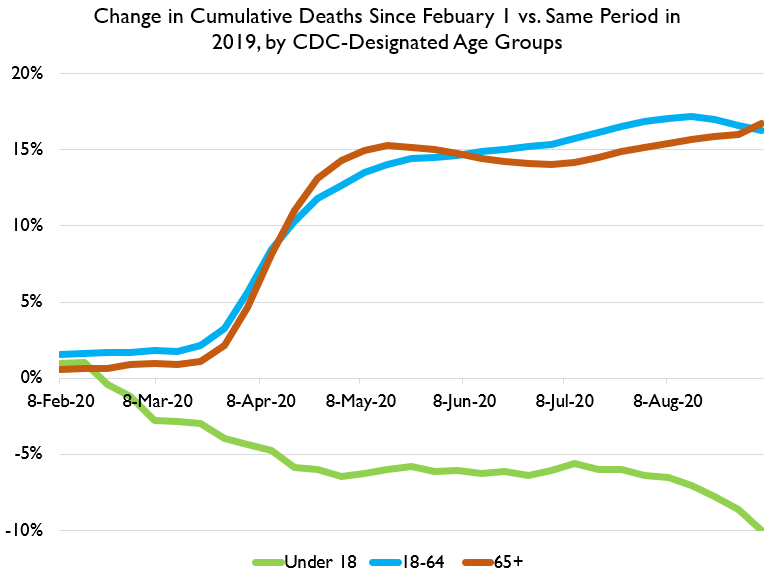
There's mixed evidence on this. ON THE ONE HAND, child deaths are way down, as I'll show below, which suggests non-COVID deaths really have been prevented to some degree.
ON THE OTHER HAND, states with lockdowns + few COVID cases do NOT show below-trend total death counts.
ON THE OTHER HAND, states with lockdowns + few COVID cases do NOT show below-trend total death counts.
The case data used to calculate R runs through September 10, calculated R has remained below 1. But it'll definitely take some time to know for sure. I am absolutely NOT ruling out the possibility of a severe autumnal wave! https://twitter.com/JessrHughes/status/1304536168160264192
I'm just saying, right now, given current R values, assuming we can keep up current precautions, "Berlin by Christmas" really does seem plausible.

 Read on Twitter