Q: When is a person not a person?
A: When they've been tested for covid-19 before.
It turns out the "number of people tested" quoted in the Test & Trace report is increasingly meaningless.
This means the positivity rates I calculated are also wrong.
Here's what happened...
A: When they've been tested for covid-19 before.
It turns out the "number of people tested" quoted in the Test & Trace report is increasingly meaningless.
This means the positivity rates I calculated are also wrong.
Here's what happened...
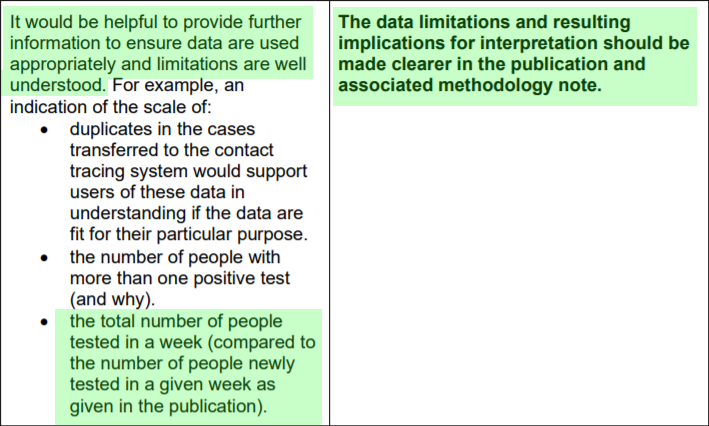
Last night @thatrogermiller pointed me to a review of the Test & Trace data by the Office for @StatsRegulation.
This suggested reporting "the total number of people tested in a week (compared to the number of people newly tested in a given week as given in the publication)".
This suggested reporting "the total number of people tested in a week (compared to the number of people newly tested in a given week as given in the publication)".
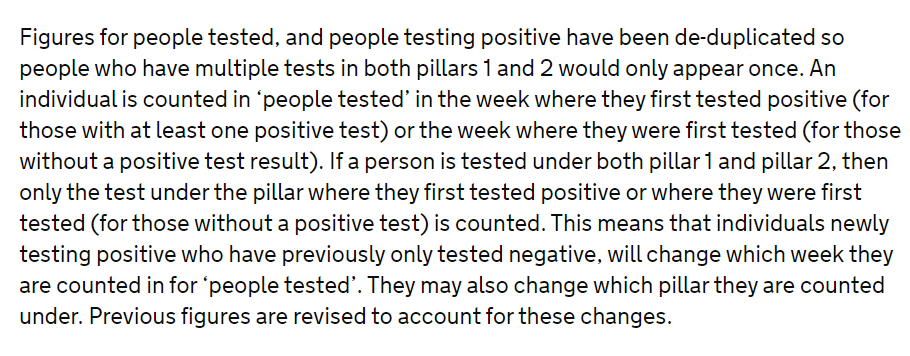
The review took place in July. The government still hasn't released the additional data @StatsRegulation suggested. The methodology doc confirms that people are only ever counted as being tested once, and using a method that results in constant revisions. https://www.gov.uk/government/publications/nhs-test-and-trace-statistics-england-methodology/nhs-test-and-trace-statistics-england-methodology#section-1
Here's how it works:
If you're tested in week 1, you're counted as a person tested in week 1.
If you're tested again in week 4, you don't count as a person.
Unless you test negative in week 1 and positive in week 4, in which case you get moved from week 1 to week 4.
Clear?
If you're tested in week 1, you're counted as a person tested in week 1.
If you're tested again in week 4, you don't count as a person.
Unless you test negative in week 1 and positive in week 4, in which case you get moved from week 1 to week 4.
Clear?

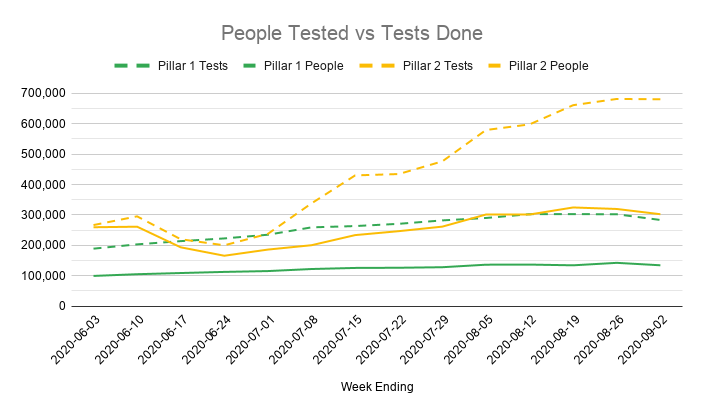
Given that people are increasingly being tested regularly (for example in care homes), this means that the "number of people tested" that's reported each week is essentially meaningless for pillar 2 (community) testing.
Which is why testing is going up but "people tested" isn't.
Which is why testing is going up but "people tested" isn't.
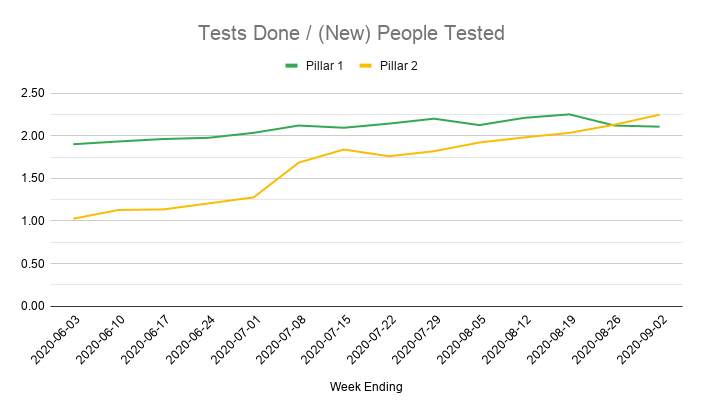
This increasingly skews the data, as you can see if you divide tests done by people tested for the first time.
Pillar 1 is fairly constant, but Pillar 2 went from about 1 test per person in the first report to over 2 now.
Up to half the people tested in pillar 2 aren't counted!
Pillar 1 is fairly constant, but Pillar 2 went from about 1 test per person in the first report to over 2 now.
Up to half the people tested in pillar 2 aren't counted!
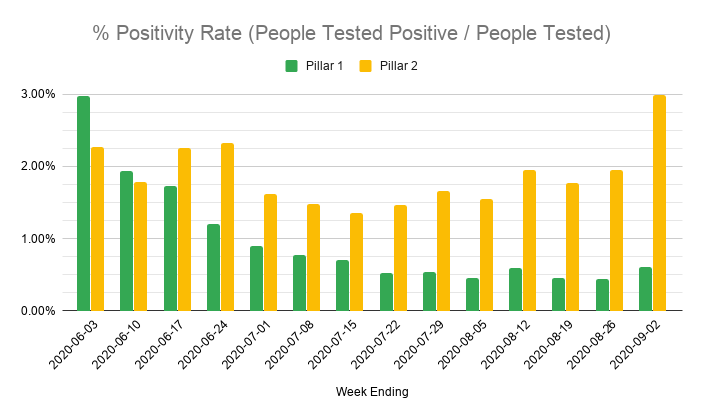
So what does this do to the positivity rate, which I was calculating based on the number of people reported as tested each week?
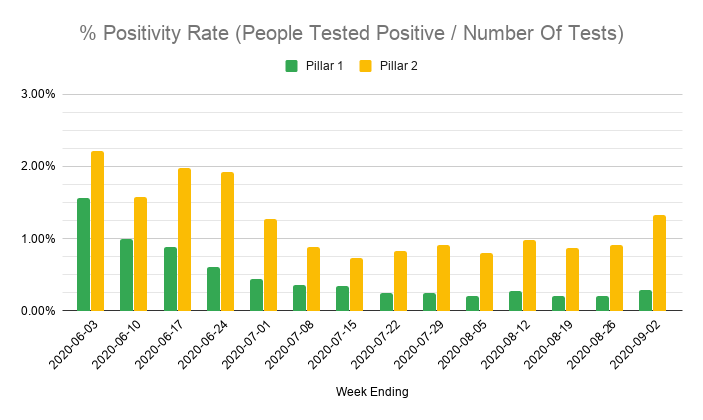
Here's a comparison of calculating positivity using the (inaccurate) number of people tested versus using the number of tests done.
Here's a comparison of calculating positivity using the (inaccurate) number of people tested versus using the number of tests done.
The positivity rates are a lot lower if you use the number of tests rather than the (now wildly inaccurate) number of people reported as tested.
BUT the overall trend still seems to hold - the positivity rate for pillar 2 testing has generally been slowly rising since mid July.
BUT the overall trend still seems to hold - the positivity rate for pillar 2 testing has generally been slowly rising since mid July.
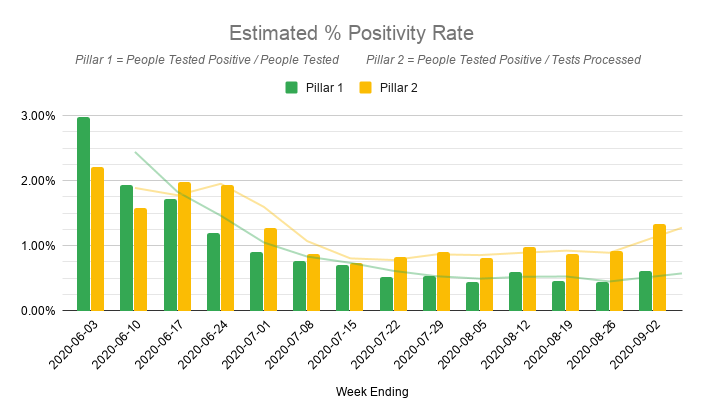
Because people are (on average) tested twice each in hospital though, this underestimates pillar 1 positivity.
So from now on I'll be using a combined graph - pillar 1 will be based on people tested, and pillar 2 will be based on number of tests.
Here's what that looks like -
So from now on I'll be using a combined graph - pillar 1 will be based on people tested, and pillar 2 will be based on number of tests.
Here's what that looks like -
This still isn't 100% accurate (pillar 1 ignores any people previously tested, and a few people may be tested more than once a week in pillar 2), but I'll keep an eye on the ratios, and unless the govt publishes the real number of people tested this may be the best we can do.
PS: The fact that over 3 months after Test & Trace launched the government still can't / won't tell us how many people it's testing each week is baffling.
Getting this number should be trivial, and it would be far more useful than how many people were tested for the first time!
Getting this number should be trivial, and it would be far more useful than how many people were tested for the first time!
What they should be doing is releasing two numbers:
- The total number of people tested each week (including people tested in previous weeks, but only counted once per week)
- The total number of people tested to date (only counted once each).
It's not rocket science.
- The total number of people tested each week (including people tested in previous weeks, but only counted once per week)
- The total number of people tested to date (only counted once each).
It's not rocket science.


 Read on Twitter