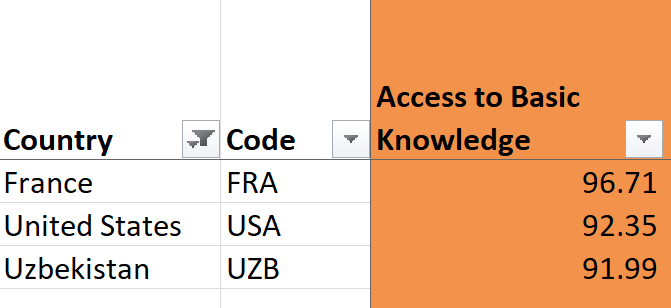
Is the US education system more on par with France or Uzbekistan?
A thread on how 'social indexes' are calculated and why you should be cautious about using them.
And how things that are obviously, glaringly wrong can be fact-checked true by the New York Times.
A thread on how 'social indexes' are calculated and why you should be cautious about using them.
And how things that are obviously, glaringly wrong can be fact-checked true by the New York Times.
Note: I will be moderately critical of @socprogress's index work and a @NickKristof NYT column here, but I want to be clear that putting together these indexes is hard, and requires messy, imperfect choices. And having imperfect indexes is better than not having indexes.
So! I'm reading a @NickKristof piece in the NYT about how the US is back-sliding, and a claim catches my eye.
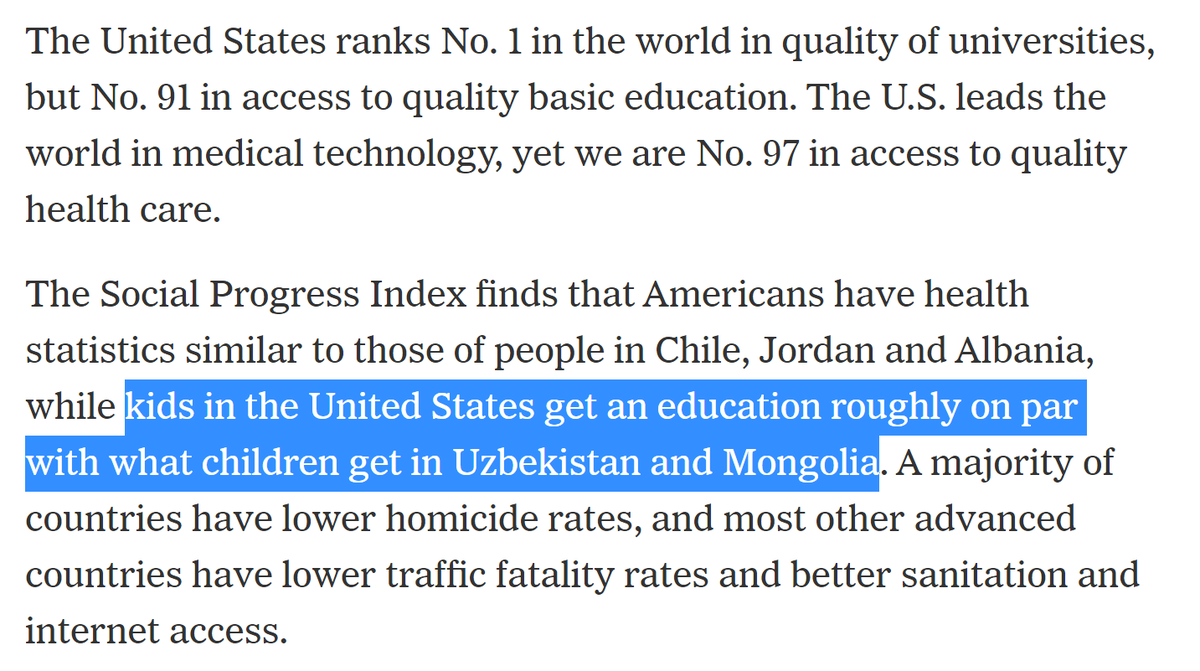
The US is only 91st in educational access? Kids in the US get an education on par with Uzbekistan? Really? I'm no expert on international educational standards or Uzbekistan, but that seems... very wrong.
So I went digging for the actual data, which comes from @socprogress
So I went digging for the actual data, which comes from @socprogress
The data is accessible in a scorecard format at https://www.socialprogress.org/?tab=2&code=USA . Below are screencaps for the US (first image, 44th rank) and Uzbekistan (second, 23rd rank).
'Access to Basic Knowledge' is a score composed from five metrics related to education. The '91st' claim comes from the sub-metric 'Access to quality education'.
Surprisingly, Uzbekistan is better on almost every metric! Case closed?
Well... no.
Surprisingly, Uzbekistan is better on almost every metric! Case closed?
Well... no.
At this point I went definition hunting and downloaded the full data (find it at https://www.socialprogress.org/download - donation suggested but not required).
Definitions available at https://www.socialprogress.org/index/global/definitions/FOW/0/4
Definitions available at https://www.socialprogress.org/index/global/definitions/FOW/0/4
(minor note: the downloadable data references Adult Literacy Rate as a sub-metric while the scorecard and definition replace it with 'Women with no schooling'. Also downloaded data is only available up to 2019. Doesn't change the thread's conclusions)
First problem: Here's the definition of 'Access to quality education':
It's a survey of experts asking "To what extent is high quality basic education guaranteed to all, sufficient to enable them to exercise their basic rights as adult citizens?" on a subjective 0-4 scale.
It's a survey of experts asking "To what extent is high quality basic education guaranteed to all, sufficient to enable them to exercise their basic rights as adult citizens?" on a subjective 0-4 scale.
That number turns out to be very important. Look at the raw 2019 stats for France (a high scoring country), US and Uzbekistan. The US-France differences in the five metrics are tiny except for that one, leading to France having a much higher overall score.
This is an issue, since the question is very subjective - what is 'low quality' vs 'high quality'? What level exactly is 'undermines their ability to exercise basic rights'?
It's also subject to cultural + political forces in the experts that may differ across countries.
It's also subject to cultural + political forces in the experts that may differ across countries.
Second problem: Uzbekistan's 2020 data may just be wrong. Go look above and see that the 2020 scorecard shows them with a stunning 99.9% secondary attainment. Which is puzzling since the 2019 download shows 90.5%. (2018, 90.5%. 2017, 89.5%. 2016, 88.5%, etc)
It seems wildly implausible that Uzbekistan jumped to 99.9% after years of hovering around 90% and this might be a mistake. This leads into a more general third problem: data reliability.
Uzbekistan's literacy rate is listed as 99.98%. Maybe that's true, I don't know the country well. But I know that some of the countries I am more familiar with *definitely* have inflated literacy rates in this data, and that 99.98% is above most rich nation standards. Hmm.
So the only metric that separates rich countries like the US & France is an incredibly subjective survey question. And the metrics that vault Uzbekistan over the US are likely data mistakes or fraud.
This leads to the fourth and most serious problem: What the data doesn't show.
This leads to the fourth and most serious problem: What the data doesn't show.
Uzbekistan has a GDP/capita of about 1500 USD, or 40x less than the US. They are very, very poor. It would be *stunning* if they could match rich nation standards, and the entire world would be rushing to figure out Uzbek secrets. This has not happened.
Instead, here are some things that have happened: Both Uzbek teachers and Uzbek children have been regularly pulled from classrooms and used by the state as slave labor in cotton fields. Some reports from teachers in the images.
https://en.wikipedia.org/wiki/Child_labour_in_Uzbekistan
https://www.uzbekforum.org/wp-content/uploads/2019/04/Cotton_Harvest_2018_Klein_Mail.pdf
https://en.wikipedia.org/wiki/Child_labour_in_Uzbekistan
https://www.uzbekforum.org/wp-content/uploads/2019/04/Cotton_Harvest_2018_Klein_Mail.pdf
We reach a situation where the original claim in the NYT piece - "kids in the United States get an education roughly on par with what children get in Uzbekistan" - is clearly indefensible and insane.
But the fact-checkers at the NYT see the claim, look up the data on a respectable website, it seems to check out, and they mark it as confirmed. And it is true that the number on the website says what it says. But the context is missing, and vital.
Now I don't want to make @socprogress a villain here. Collecting reliable international data is nightmarishly hard for a ton of reasons. And constructing indexes to measure very different countries requires measurement choices that can never be perfect.
Similarly: It is much, much harder than most people realize to write regular opinion columns that are original, intelligent and thoughtful. I'm not besmirching @NickKristof just because he used a stat incorrectly. It happens to everyone.
I'm glad indexes like these exist, flawed as they are. But before you use them to demonstrate a point, you need to understand them. Carefully check that they actually say what you think they say. And not just 'look up the number on a website', but *really* check.
In general, be cautious about reading into grand announcements about country rankings on these indexes.
They can be useful in a directional sense, but they also suffer from bad data points, subjectivity, and there's a lot they don't capture.
/end
They can be useful in a directional sense, but they also suffer from bad data points, subjectivity, and there's a lot they don't capture.
/end

 Read on Twitter


