. @gelliottmorris and @NateSilver538 have posted conditional probability tables of their models vs. the national popular vote margin. Very useful! But, these tables do not account for national polling average uncertainty.
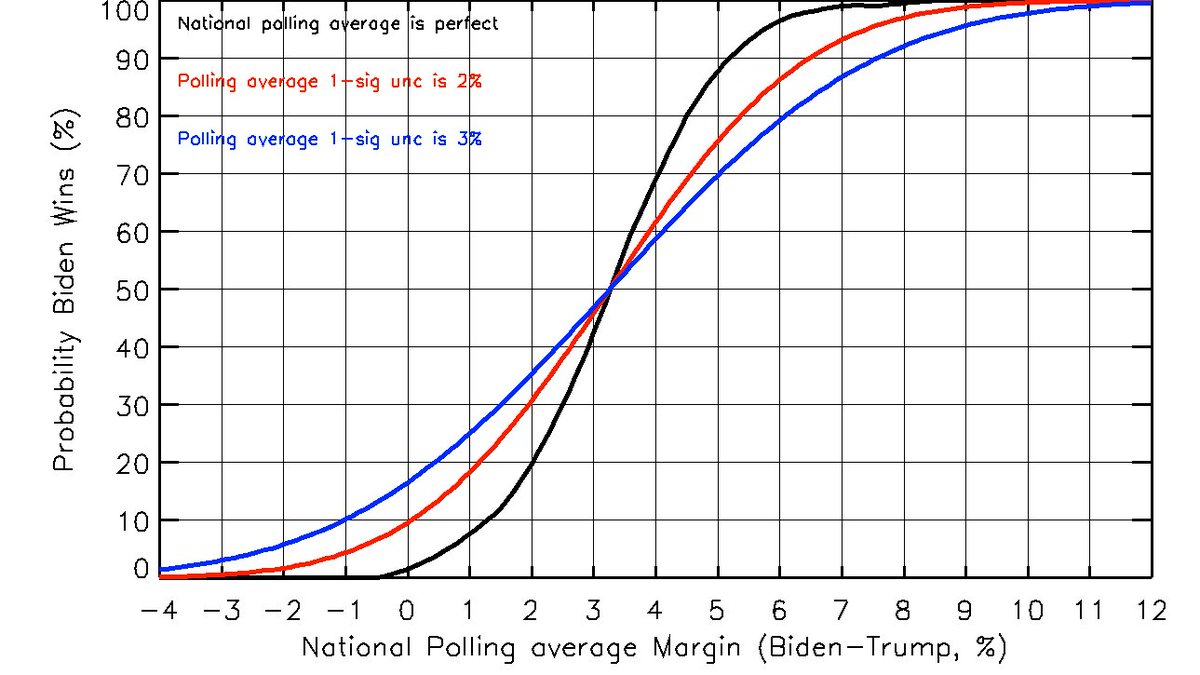
Accounting for that uncertainty (Economist):
1/
Accounting for that uncertainty (Economist):
1/
The black line above is just an upscaled version of @gelliottmorris's table. This should be thought of as the probability due to uncertainty in the relative lean of the EC, assuming we know the national popular vote outcome.
2/ https://twitter.com/gelliottmorris/status/1301200302620717058?s=20
2/ https://twitter.com/gelliottmorris/status/1301200302620717058?s=20
Historically the final national polling average has missed the actual popular vote margin by an average of ~2%.
It missed by 2% again in 2016. Perfectly average!
If we assume a normal standard error of 2% we get the red line in my plot (3% blue).
3/
https://fivethirtyeight.com/features/trump-is-just-a-normal-polling-error-behind-clinton/
It missed by 2% again in 2016. Perfectly average!
If we assume a normal standard error of 2% we get the red line in my plot (3% blue).
3/
https://fivethirtyeight.com/features/trump-is-just-a-normal-polling-error-behind-clinton/
So my red line should be interpreted as the conditional probability that Biden wins considering the uncertainty in the EC *AND* the uncertainty in the national polling average (sorta like a conditional "nowcast").
4/
4/
Example:
Polls tighten to 5% on election day.
If they are exactly right, uncertainty in EC means Biden has a ~87% chance of winning.
But additional uncertainty in the final nat polling average means Biden's chances are only 75% (or 69% for 3% unc).
Favored, but not safe.
5/
Polls tighten to 5% on election day.
If they are exactly right, uncertainty in EC means Biden has a ~87% chance of winning.
But additional uncertainty in the final nat polling average means Biden's chances are only 75% (or 69% for 3% unc).
Favored, but not safe.
5/
Given the rigidity of opinions for/against Trump, I actually have a difficult time seeing it tighten to +5. What if things stay the same and Biden is +8 on Election day?
Nat polls perfect: 99% Biden wins
Assume 2% unc: 97% Biden wins
Assume 3% unc: 93% Biden wins
6/
Nat polls perfect: 99% Biden wins
Assume 2% unc: 97% Biden wins
Assume 3% unc: 93% Biden wins
6/
Table form:
UNC: 0%, 2%, 3%
+0-1: 4%, 14%, 21%
+1-2: 12%, 25%, 30%
+2-3: 30%, 39%, 43%
+3-4: 57%, 55%, 53%
+4-5: 80%, 69%, 65%
+5-6: 93%, 82%, 75%
+6-7: 98%, 91%, 84%
+7-8: 99%, 96%, 90%
If Biden is ahead in EC, nat poll uncertainty hurts, if he is behind it helps.
7/
UNC: 0%, 2%, 3%
+0-1: 4%, 14%, 21%
+1-2: 12%, 25%, 30%
+2-3: 30%, 39%, 43%
+3-4: 57%, 55%, 53%
+4-5: 80%, 69%, 65%
+5-6: 93%, 82%, 75%
+6-7: 98%, 91%, 84%
+7-8: 99%, 96%, 90%
If Biden is ahead in EC, nat poll uncertainty hurts, if he is behind it helps.
7/
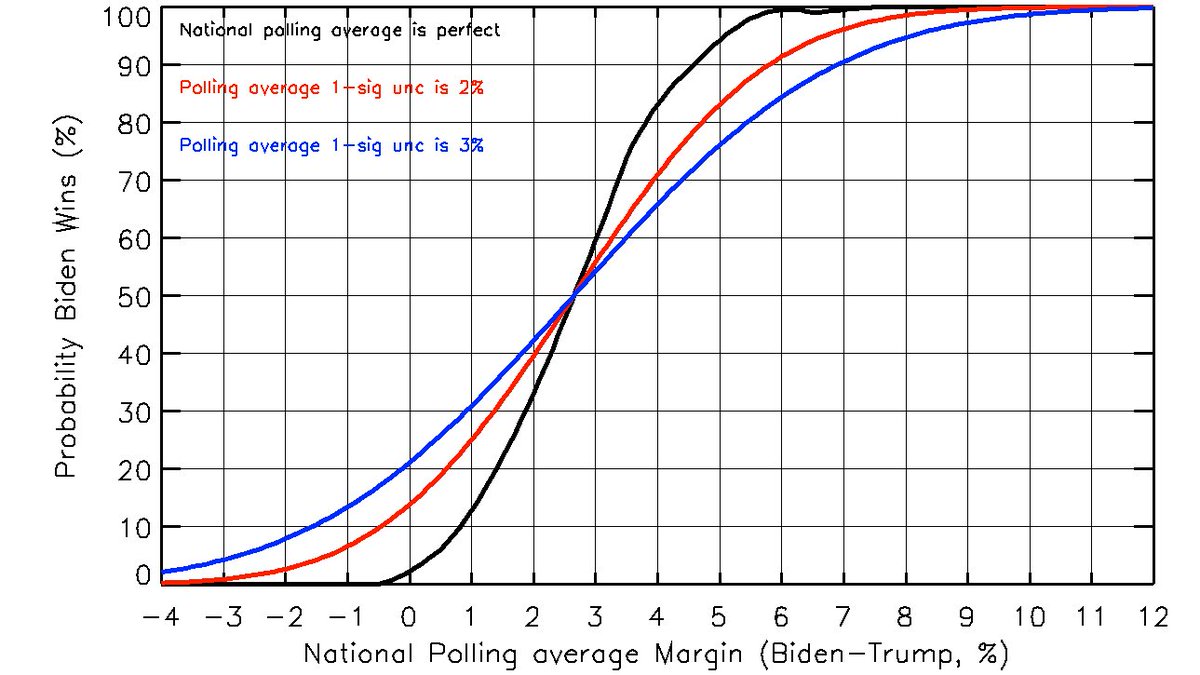
If we instead assume the 538 evaluation of the EC uncertainty, this is what we get.
The most obvious difference is 538 seems to think Trump has a little less of an advantage in the EC on average (+2.6 R vs +3.3 R).
8/
https://twitter.com/NateSilver538/status/1301190941110341632?s=20
The most obvious difference is 538 seems to think Trump has a little less of an advantage in the EC on average (+2.6 R vs +3.3 R).
8/
https://twitter.com/NateSilver538/status/1301190941110341632?s=20
Caveat: this all assumes that the polling error probabilities can be approximately modeled using a normal distribution as wide as the average historical polling errors or perhaps a little bit wider (3% example).
Maybe we get a history breaking outlier this time?!?
9/
Maybe we get a history breaking outlier this time?!?
9/
If you liked this thread, please RT! 
10/

10/

 Read on Twitter


