A quick C19 update on Gemany. RKI only posts test data weekly, so this chart is by calendar week. After a period of stable testing, Germany has doubled weekly tests, leading to certain breathless headlines. Positivity rate has been stable around 1% for about 3 months now.
One of the more curious charts RKI provides is the split into reporting by onset of symptoms (blue) vs by reporting date (yellow), roughly matching symptomatic vs asymptomatic cases, which indicates that the rate of asymptomatic cases is on the rise.
Another interesting chart I haven't seen before is the comparison of Covid (red) to general fatality in 2020, the last flu-intensive year 2018, and a recent average. C19 is on track to account for ~1% of annual fatalities. For Germany, that's "less than a flu season".
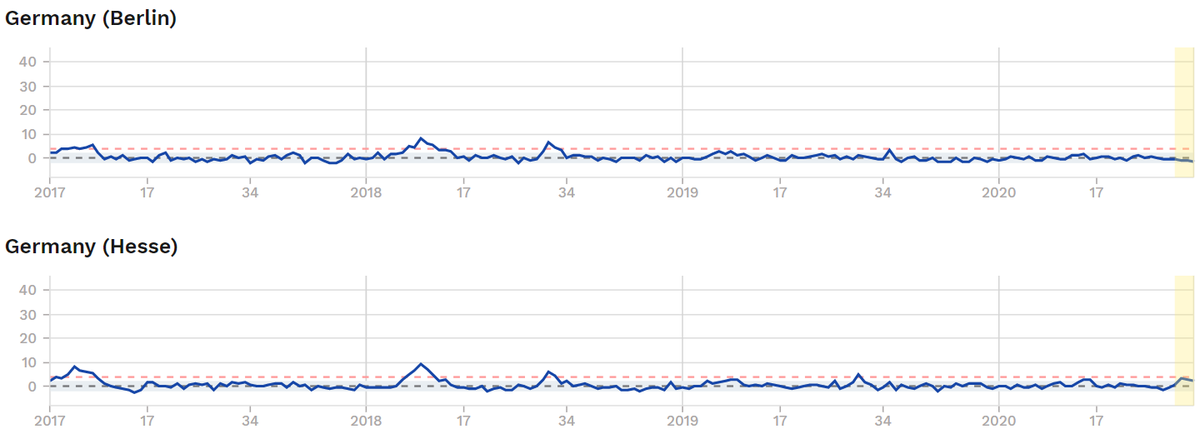
Note that the 2018 trajectory had a smaller "heat peak" in the summer months. This is confirmed by the Euromomo data, so apparently respiratory diseases like the cold and the heat. https://www.euromomo.eu/graphs-and-maps#z-scores-by-country

 Read on Twitter


