Delighted to share on @thecurrency the results of some of my research over the last few yrs on Irish housing prices since WW2. The paper on which it's based is forthcoming in the Journal of Real Estate Finance & Economics (h/t @ThiesLindenthal). Here are the highlights... (1/12) https://twitter.com/thecurrency/status/1296491434200031232
Housing is central to the broader economy, as highlighted by the Great Recession of 2007–2009. Yet, perhaps to the surprise of non-specialists, few reliable long-run series exist for sale and rental prices of housing, not just in Ireland but anywhere - incl the USA. (2/12)
In this paper, Richard Keely and I use a detailed dataset of >1m sale and rental listings from newspapers and online since World War 2, and modern methods, to build new reliable indices of sale and rental prices for Dublin as a whole and for 6 sub-markets within the city. (3/12)
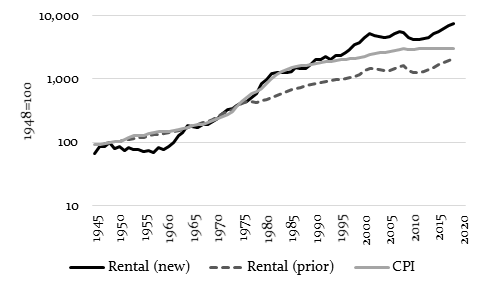
Sale prices rose by an average of 8.4% per year between 1945 and 2018, compared to an increase in general consumer prices of 5%. Market rents - shown in the graph - are estimated to have increased by 6.3% per year, well above prior official estimates (4.4%). (4/12)
This finding that rents have been mismeasured - and in particular rent increases have been underestimated - has implications for accurately measuring living costs and living standards in Ireland since World War II. (And Ireland is not alone - more on this at the end...) [5/12]
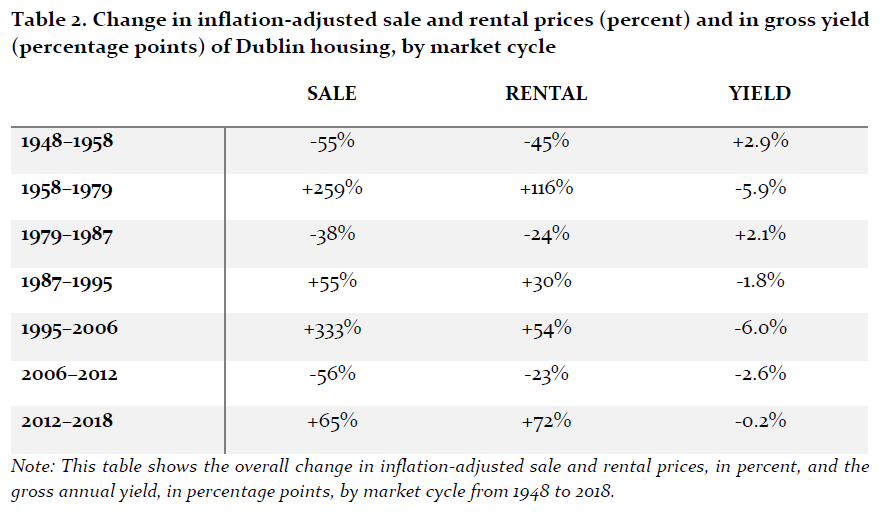
Adjusting for inflation*, there have been four major housing market cycles since 1945, with peaks in the late 1940s, the early 1970s, the early 1980s and the mid-2000s. The 1950s were grim! (6/12)
* Inflation will itself have to be adjusted to reflect more accurate rent trends!
* Inflation will itself have to be adjusted to reflect more accurate rent trends!
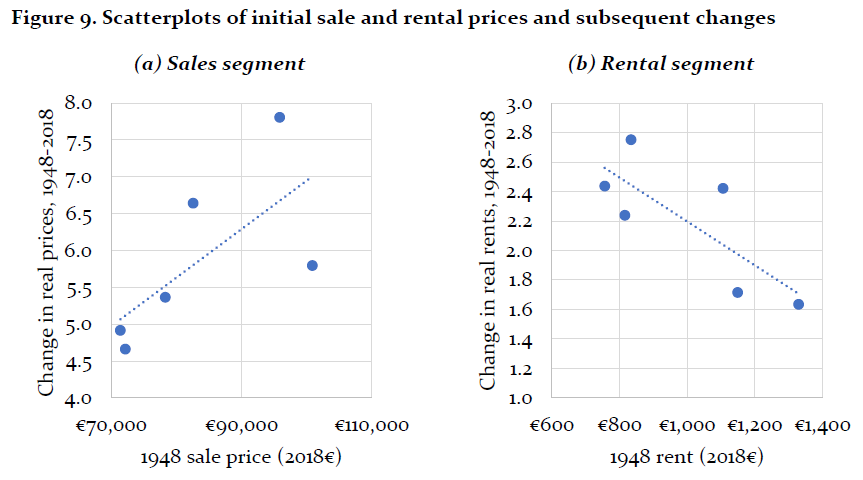
There were fewer differences in housing price trends within the city than I might have expected. Sale prices did rise *more* in initially more expensive locations, though, while in the rental market, the opposite happened: there was some convergence. (7/12)
If you divide sale prices by rent, you get a fundamental barometer of housing market health, the 'housing price ratio' (similar to the yield). We identify 3 phases in this, with downward shifts in the yield in early 1970s and mid-1990s. Yields by Dublin market shown below. (8/12)
To close the paper, we examine whether we can explain changes in this ratio using basic economics. In short, yes: conditions in the credit market and user cost drive changes in the yield over time. 1970s inflation looks to have pushed prices up by eroding ground rents. (9/12)
So what? The results support the idea that Dublin has engineered its housing crisis of the last 10/30 years. If housing supply had been adequate (and credit supply controlled), there is no need for Dublin to have become twice as expensive as the rest of the country. (10/12)
What next? The obvious next step to this research for Ireland is to improve existing measures of inflation and living standards by including more accurate measures of housing costs. Housing prices are tricky to measure well and the same problem exists in other countries. (11/12)
(12/12) That's why, with support from @landpolicy and @NSF, @econhist_allday, @RowenaGray6 and I are building better series of sale and rental prices for the US. We're about a million ads in and maybe only a million to go!
FIN!
https://www.nsf.gov/awardsearch/showAward?AWD_ID=1918554
FIN!
https://www.nsf.gov/awardsearch/showAward?AWD_ID=1918554
Unlucky 13/12: I somehow forgot to include a link to the paper itself in all that. If you'd like to have a read, it's available from here: http://www.ronanlyons.com/research-2/

 Read on Twitter


