Thread-QE & Inequality: Time for the @bankofengland to come clean?
I had to do some research on the distributive effects of QE and so thought I would share thoughts.
Key message - absent a fiscal stimulus, QE will have distributive effects. The Bank should be open about this.

I had to do some research on the distributive effects of QE and so thought I would share thoughts.
Key message - absent a fiscal stimulus, QE will have distributive effects. The Bank should be open about this.
I should caveat that I do think the UK is lucky to have one of the most progressive central banks in the world. And I have had very positive engagements with them since joining @NEF NEF.
But I have found their position on the distributive effects of QE especially quite dubious.
But I have found their position on the distributive effects of QE especially quite dubious.
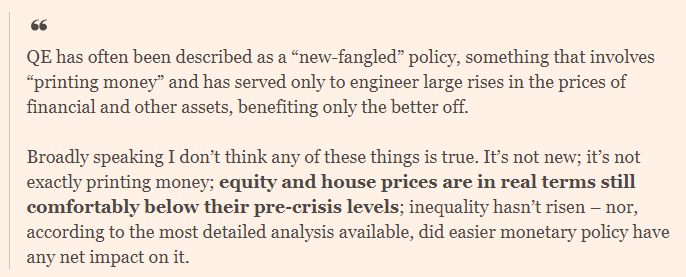
For example, in an excellent article for the @FTAlphaville, @TomHale_ wrote about a particularly striking speech by Deputy Governor Ben Broadbent in 2018, which very much exemplifies the @bankofengland's stance since. Where Broadbent said 


Mark Carney made similar remarks in 2016: "Has monetary policy robbed savers to pay borrowers? Has the MPC been Robin Hood in reverse?’ In a word, no."
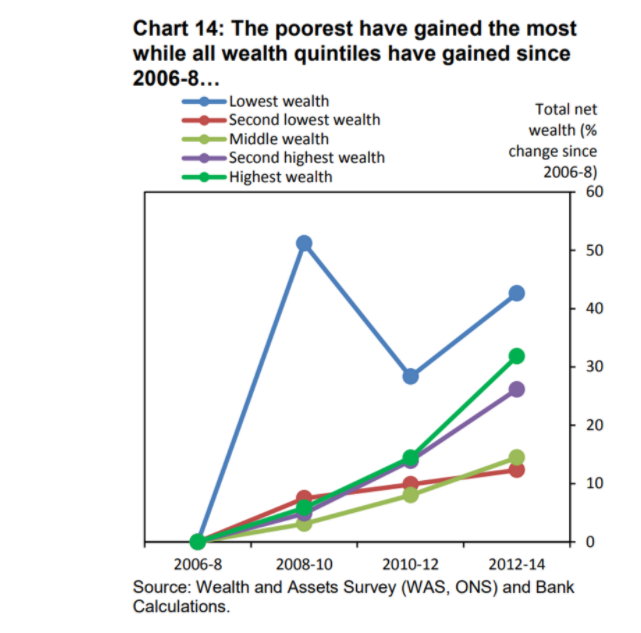
He used this figure to support his conclusion- which has been similarly used to back claims around QE and wealth inequality.
He used this figure to support his conclusion- which has been similarly used to back claims around QE and wealth inequality.
First thing to note is that QE first started in the UK in 2009. Based on the data this would suggest that the wealth of the lowest and second lowest has actually fallen - its negative.
But even without fudging the dates what has been the effect?
But even without fudging the dates what has been the effect?
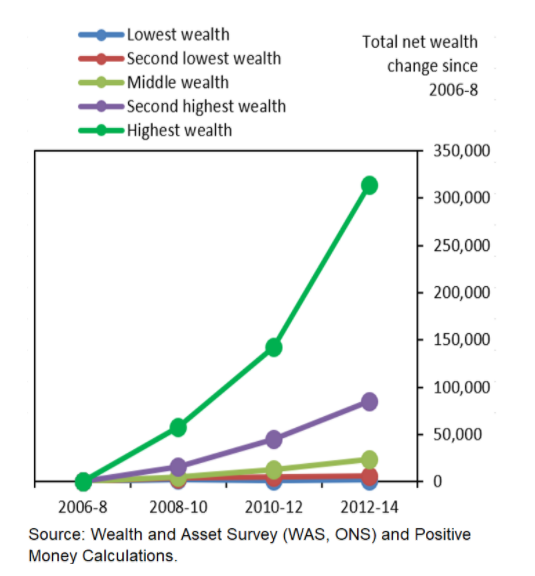
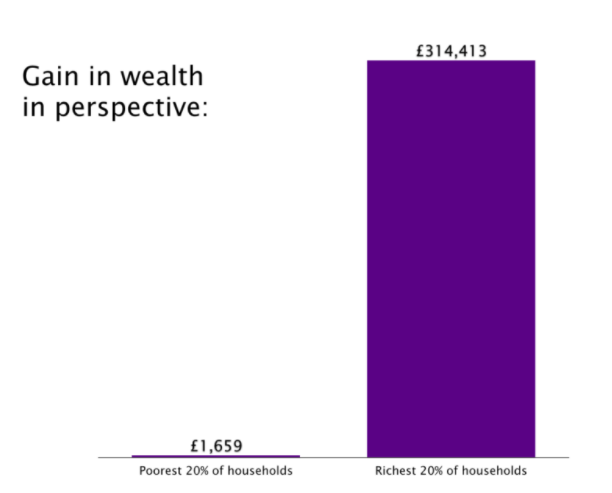
In article for @PositiveMoneyUK my good friend Ed Smythe, crunched the numbers and showed the 43% recorded increase in net wealth of the poorest fifth of households reflected a £1,659 increase in net worth (from -£3,896 in 2006-08 to -£2,237 in 2012-14).
Meanwhile, the 32% recorded increase in net wealth of the richest fifth of households reflected a £314,143 increase in net worth (from £987,209 per household to £1,301,352).
THE WEALTH GAINS FOR THE WEALTHIEST 5th WAS 189 TIMES THAT OF THE LOWEST!!!
THE WEALTH GAINS FOR THE WEALTHIEST 5th WAS 189 TIMES THAT OF THE LOWEST!!!
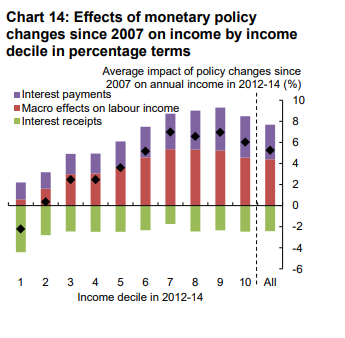
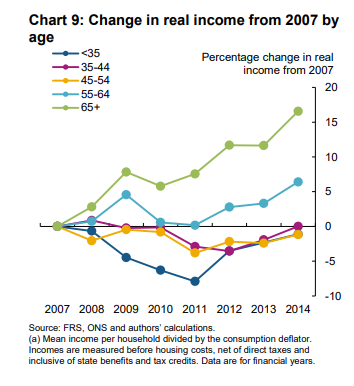
What about its impacts on the income of different age groups? A graph from the Bank's own research on QE and inequality speaks for itself.
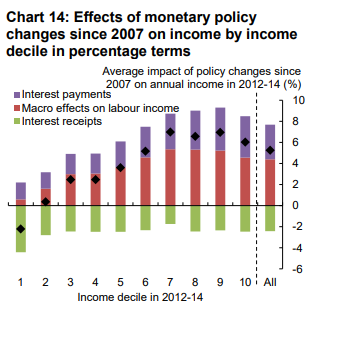
Then there is this (H/t @Pierre_Monnin). Where the Bank claimed the impact of monetary easing on income in the UK was broadly similar across households...
I wonder how the lowest income decile feels about that? Is it just me or is there and upward sloping curve going on there?
I wonder how the lowest income decile feels about that? Is it just me or is there and upward sloping curve going on there?

And as @TomHale_ pointed out (among many excellent points), at the time of Broadbent's speech - yes real house prices hadn't reach pre-crisis peak, but real incomes had fallen relative to these prices. https://ftalphaville.ft.com/2018/08/03/1533287928000/The-Bank-of-England-has-a-strange-idea-of-what-QE-achieved/
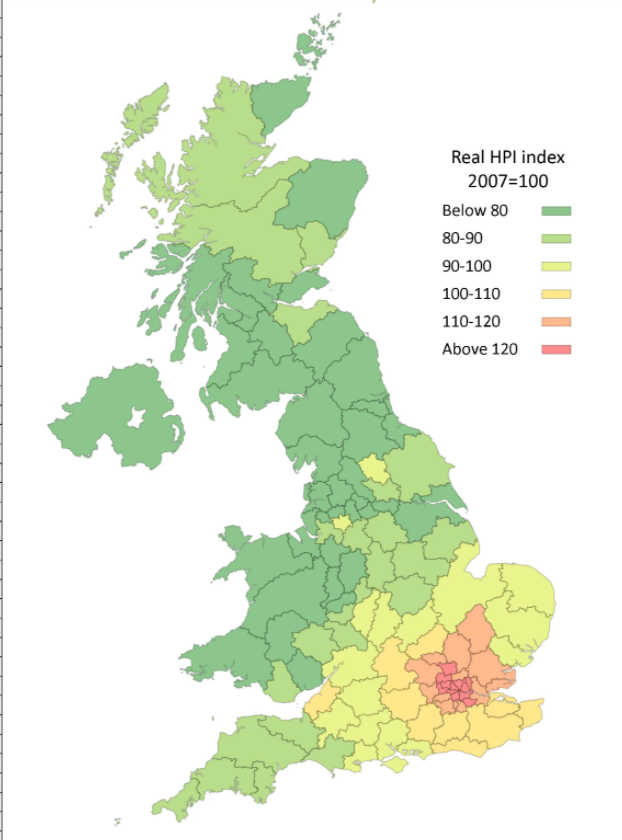
@TomHale_ also makes the excellent point that there were also huge geographical differences in house prices rises. Like the 30% house price rise in London and 10% in South-East.
Now, Im very sympathetic to arguments that the @bankofengland did what it could. I like others ( @Frances_Coppola) have argued that the Treasury threw the bank under the bus in leaving it to do all counter-cyclical heavy lifting. https://neweconomics.org/2018/08/ending-the-fiscal-monetary-tug-o-war
And I think its ridiculous that @George_Osborne and @theresa_may have the audacity to say QE causes inequality, when they have both approved it - and hello, just happen to be some of the architects of austerity. Austerity is much worse!!! https://neweconomics.org/2019/02/new-analysis-reveals-how-much-austerity-has-cost-each-person-in-the-uk
As Carney said ‘all monetary policy has distributional effects, but it is the role of elected governments to take measures to offset them’.
But like Ed Smythe, "this can only happen if the gov is given a fair and accurate picture of what the distributional effects have been.
But like Ed Smythe, "this can only happen if the gov is given a fair and accurate picture of what the distributional effects have been.

 Read on Twitter