(1/THREAD) Sentiment: One might think, with the #market erasing all its losses, that sentiment would have gotten somewhat lopsided, but it hasn’t. Here, flows into equity funds & ETFs & money market funds. #equities #SPX
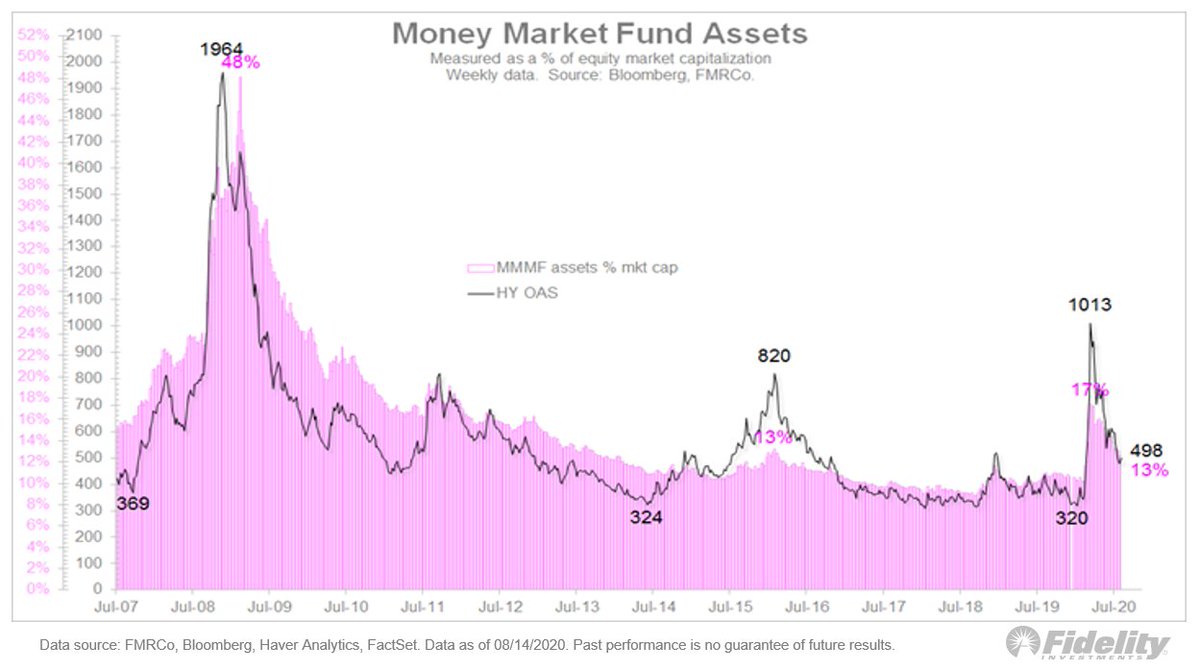
2/ The rush into #cash has barely been undone, while #investors aren’t exactly rushing into #equities. While cash sitting in money market funds has dropped slightly from nearly $5 trillion to about $4.55 trillion, it has fallen from 17% to 13% as a percent of equity market cap.
3/ Looking at the percent of equity market capitalization is probably a better way to slice the data as a proxy for sentiment and it has matched almost perfectly the spread on high-yield corporate #bonds. The rest of the sentiment picture is mixed too.
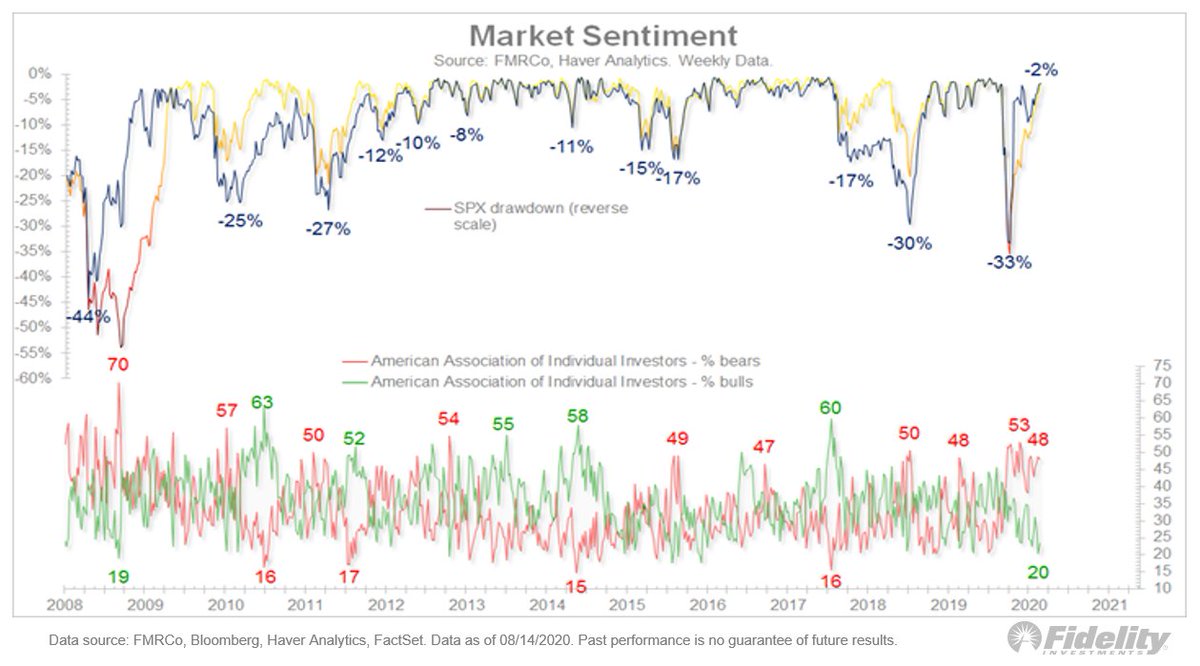
4/ This chart shows the American Association of Individual Investors survey, which reflects an older audience. Here, we see the % of bulls (green line) remains near record lows despite the 50% gain in stock prices since the March low. #stocks #investors #investing
5/ Apparently, many #boomers haven’t returned to the market yet. The younger-skewing day traders are a different story. While the #data is anecdotal at best, we can see here that the Goldman Sachs “retail favorites” basket is closing in on its June 8th momentum peak. #retail
6/ This is clearly a growing force in the market. Meanwhile, the CNN fear & greed index is now in the high-neutral zone at 72. That’s well below the February peak of 93 but well above the March low of 5.
7/ Finally, if there’s one group that seems to have nailed the bottom, it’s corporate insiders. This chart shows the Vicker’s insider buying/selling ratio. Insiders bought their company stock in size back in March, and since then have retreated.
8/ This is quite normal and the insider data shows a much better signal at bottoms than at tops. Insiders are considered “smart money,” so it’s interesting to pay attention to what they’re doing. (END)

 Read on Twitter


