A couple of interesting points from the Test & Trace report for the week ending 11 August.
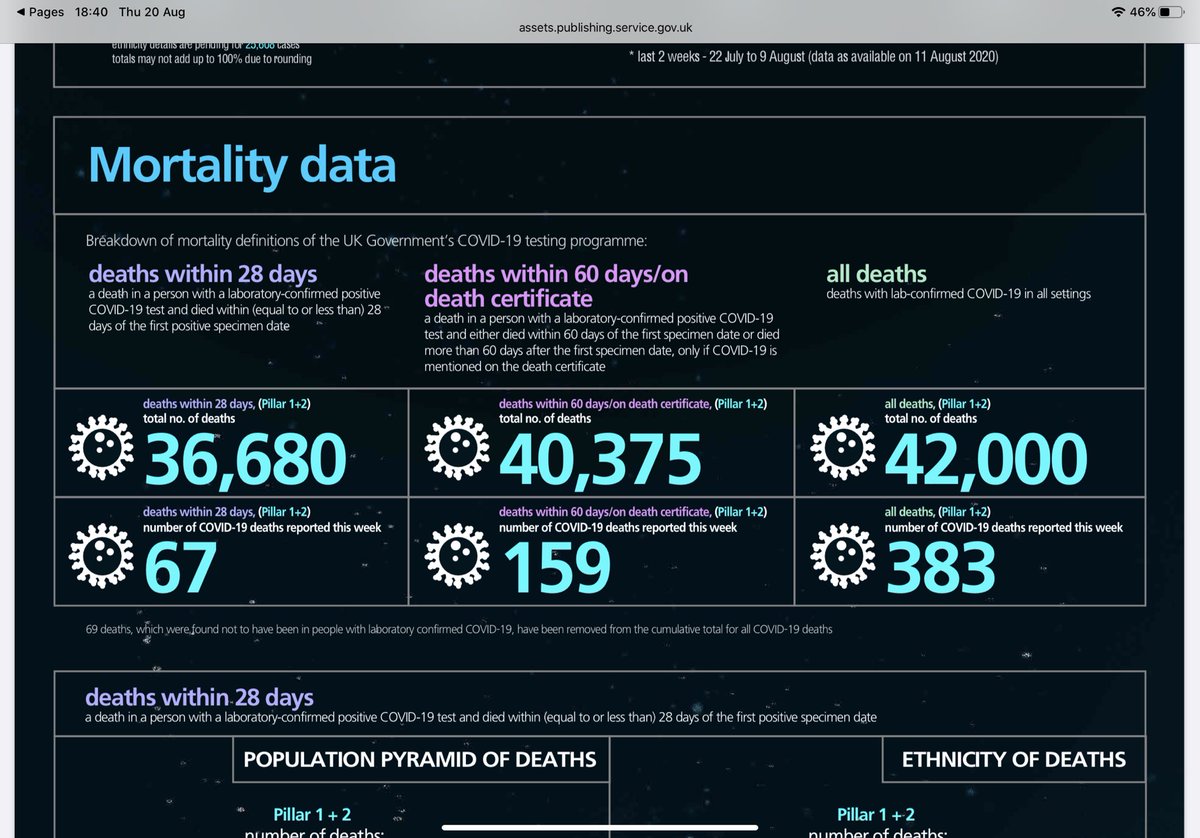
1st. Remember the 5k deaths removed from the DHSC count because of the arbitrary 28 day cut off point?
Look at this week comparing 28 days with 60 days. There are more than double
1st. Remember the 5k deaths removed from the DHSC count because of the arbitrary 28 day cut off point?
Look at this week comparing 28 days with 60 days. There are more than double
And the 60 day group not only had a positive test but also had Covid in the death certificate.
But somehow they aren’t counted on the DHSC daily returns, because they had the temerity to put up a fight.
All with CV19 on death cert
https://assets.publishing.service.gov.uk/government/uploads/system/uploads/attachment_data/file/909423/COVID19_Weekly_Report_12_August.pdf
But somehow they aren’t counted on the DHSC daily returns, because they had the temerity to put up a fight.
All with CV19 on death cert
https://assets.publishing.service.gov.uk/government/uploads/system/uploads/attachment_data/file/909423/COVID19_Weekly_Report_12_August.pdf
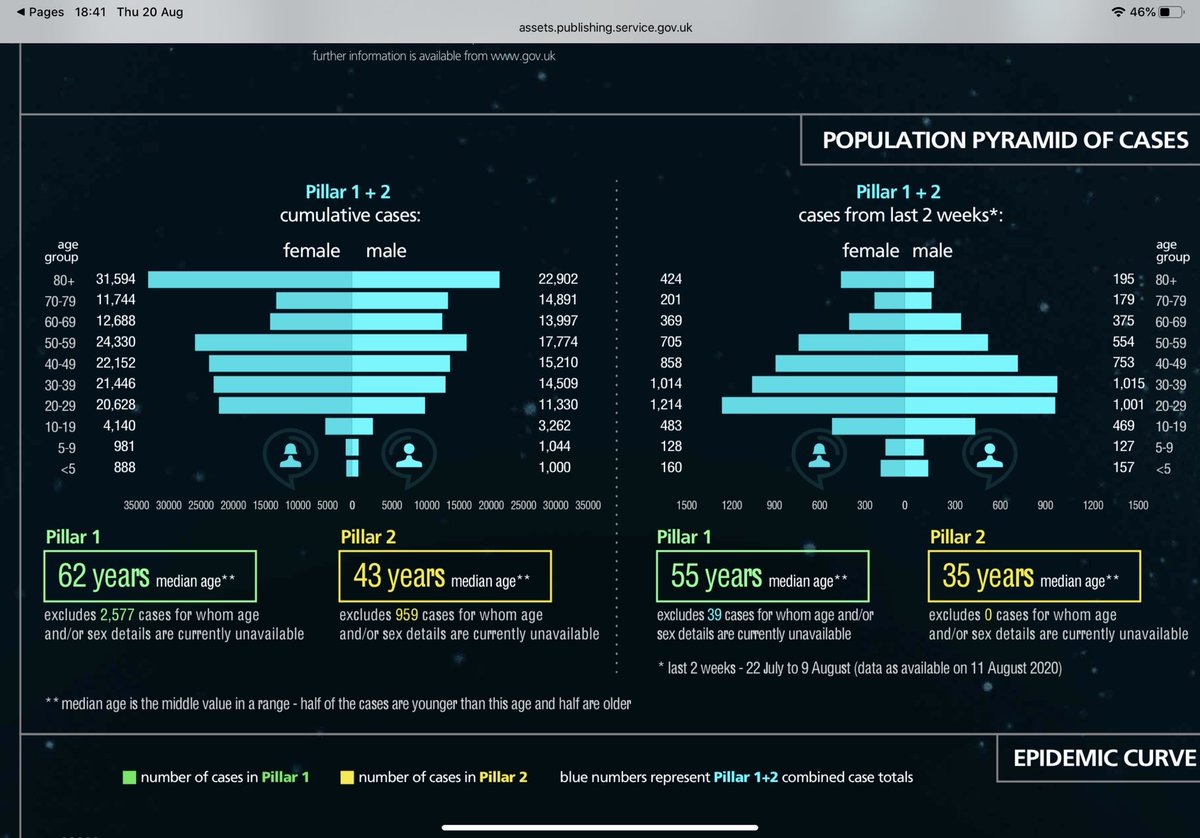
The second graph of interest is seeing how the cumulative age distribution of cases has changed. Of course, in part this is due to changing testing capacity, criteria and who is tested.
But the last 2 weeks 20-39 age group dominate with 20-59 accounting for most cases.
But the last 2 weeks 20-39 age group dominate with 20-59 accounting for most cases.
Under 5s exceed 5-9 olds.
But 10-19 yr olds exceeds 0-9 yr olds in positive cases.
But 10-19 yr olds exceeds 0-9 yr olds in positive cases.
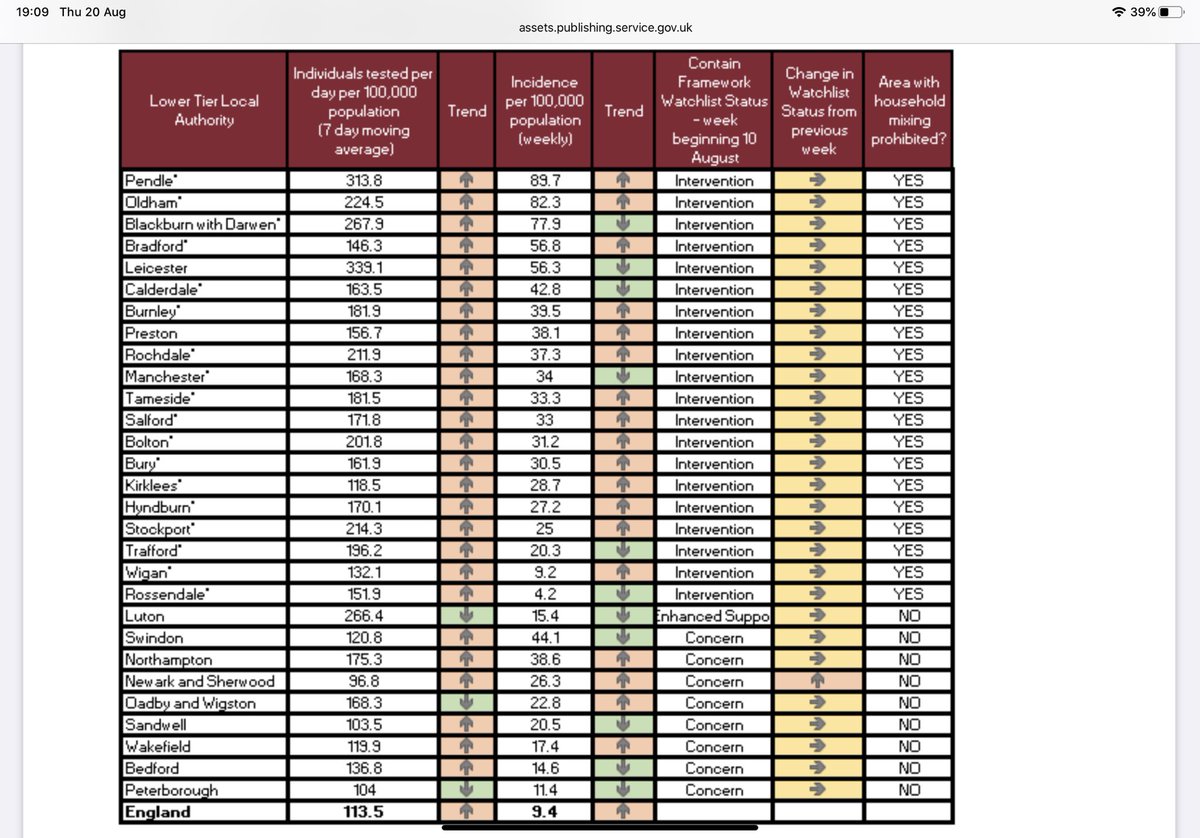
Distribution of cases by Region in England
NW highest followed by
Yorkshire and Humber
North East
East Midlands
West Midlands
London
East if England
S East
With South West happily trailing @ 244 per 100k people
Nothing to be complacent about but markedly less than all others
NW highest followed by
Yorkshire and Humber
North East
East Midlands
West Midlands
London
East if England
S East
With South West happily trailing @ 244 per 100k people
Nothing to be complacent about but markedly less than all others
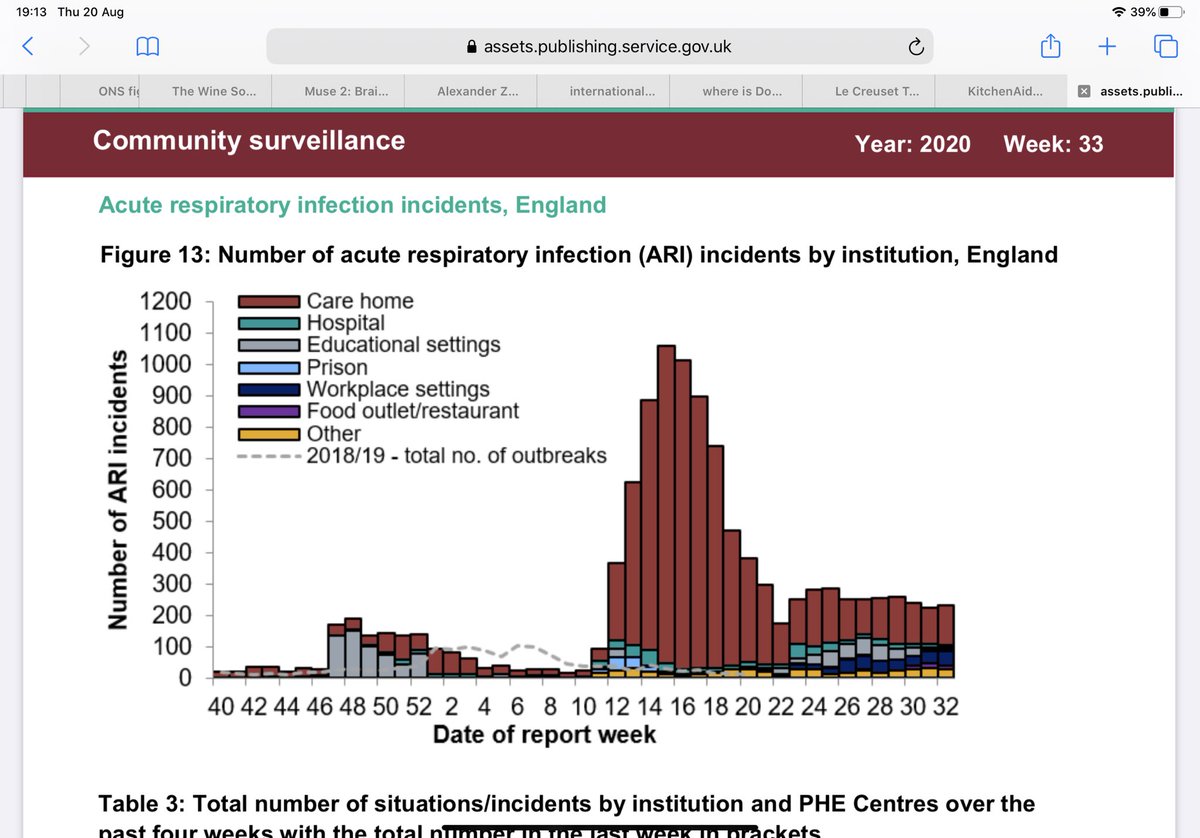
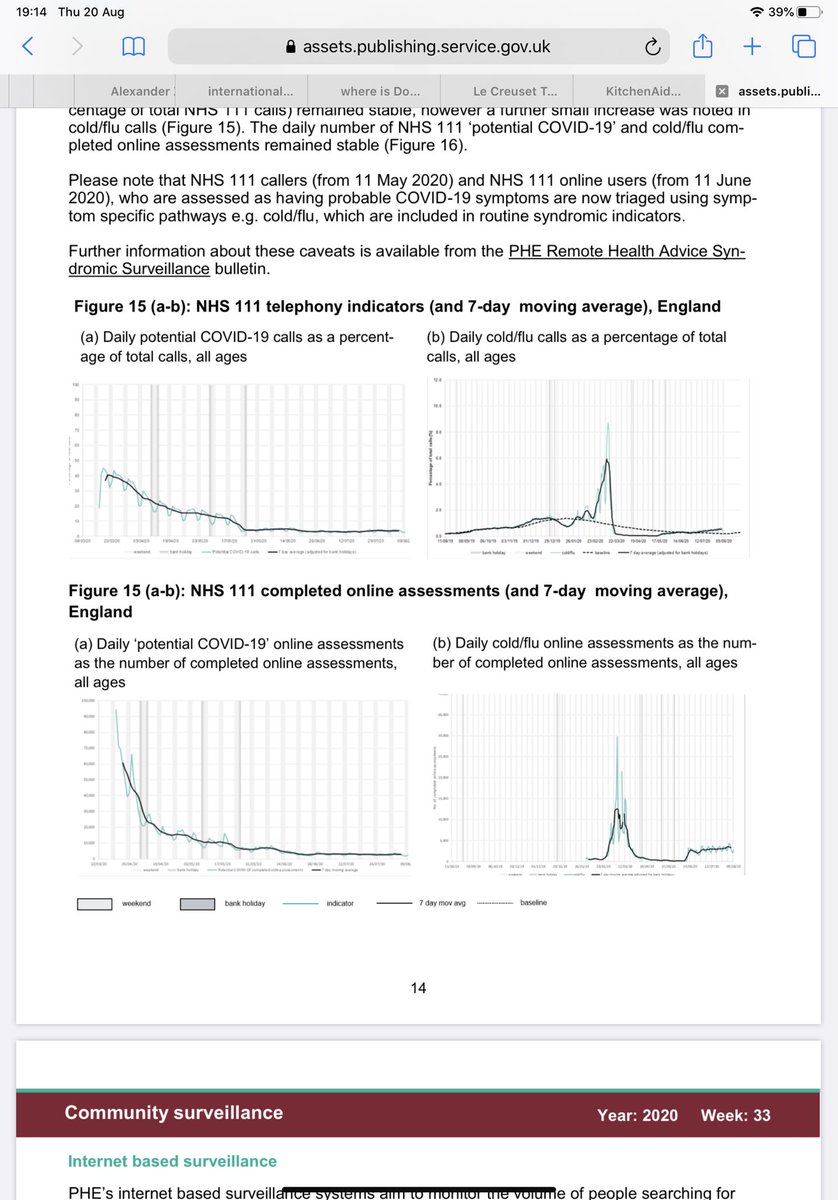
A few other details from PHE report for the same week
https://assets.publishing.service.gov.uk/government/uploads/system/uploads/attachment_data/file/909424/Weekly_COVID19_Surveillance_Report_week_33_FINAL.pdf
https://assets.publishing.service.gov.uk/government/uploads/system/uploads/attachment_data/file/909424/Weekly_COVID19_Surveillance_Report_week_33_FINAL.pdf
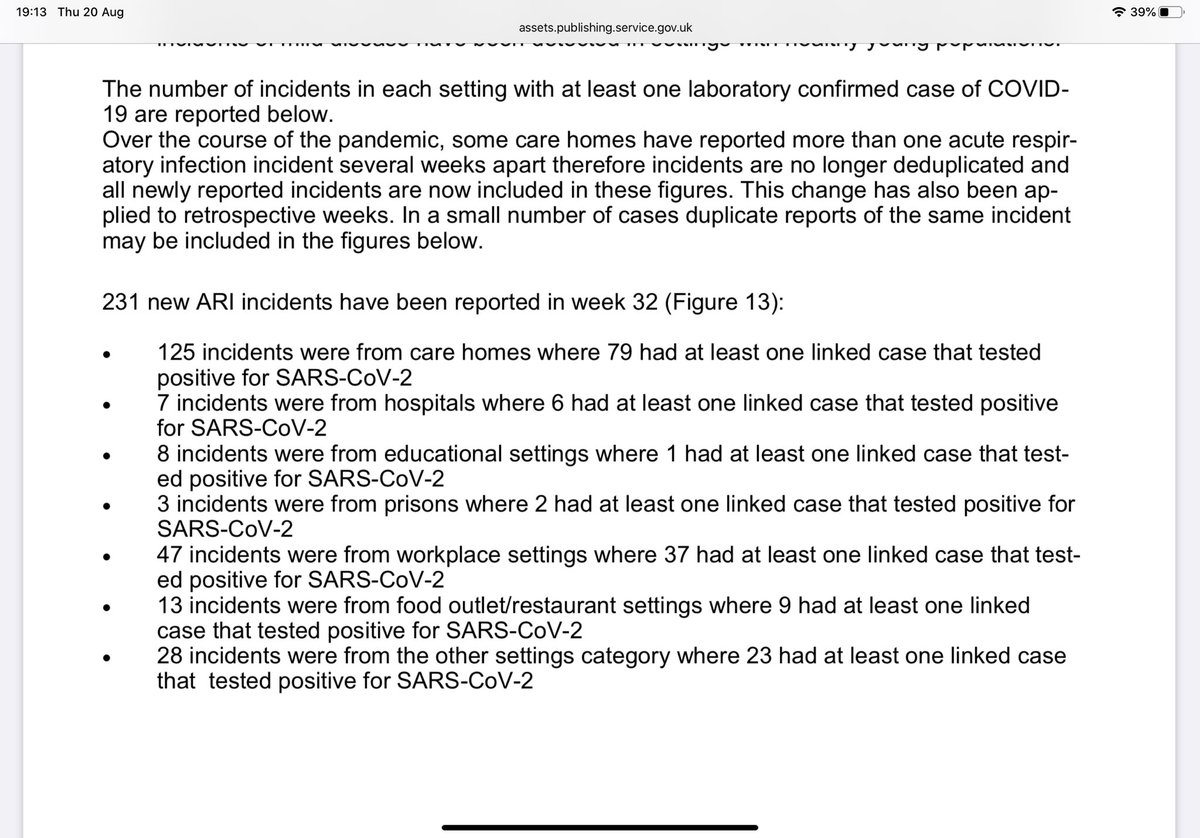
The settings where there have been clusters outside the home still suggests that care homes has had most incidents (125).
Workplace following next with 47 incidents.
Just 13 from food outlets and restaurants
Workplace following next with 47 incidents.
Just 13 from food outlets and restaurants
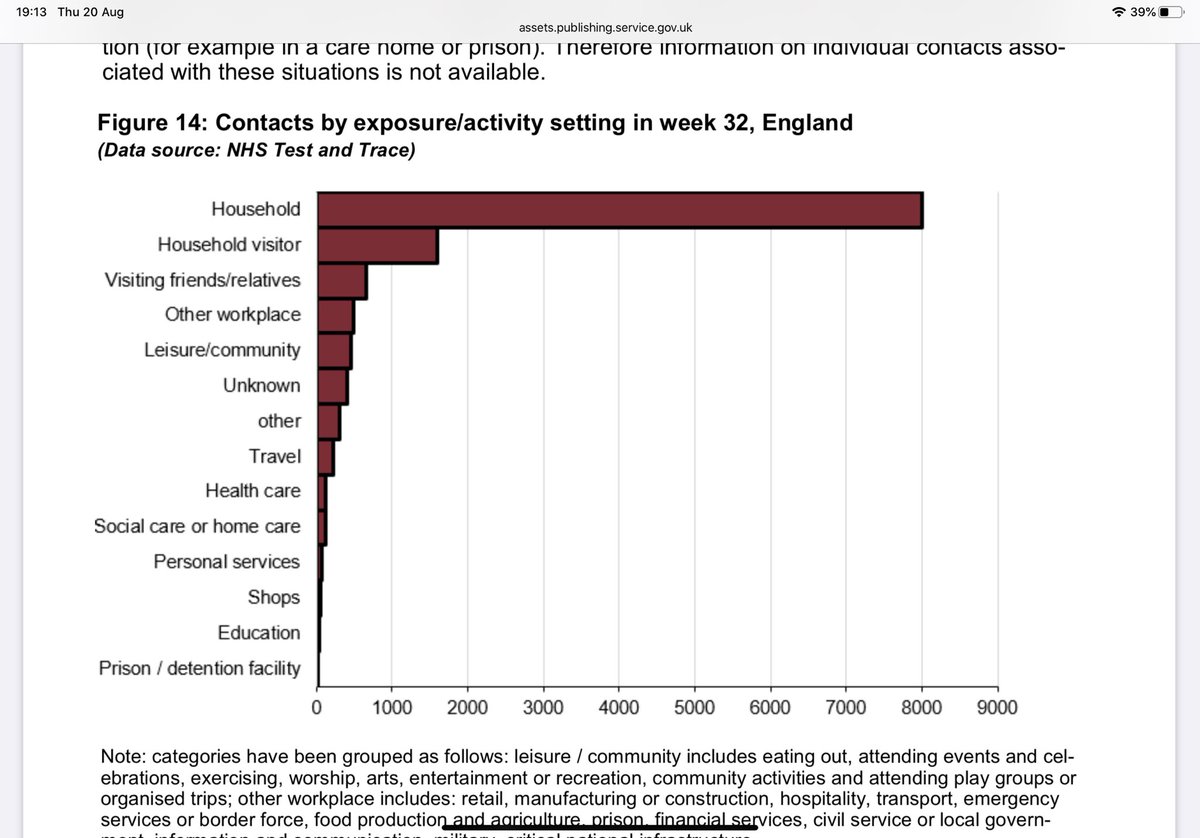
Overall, however, transmission is loaded strongly towards households with household visitors next but way behind.

 Read on Twitter