 Navigating #FPL Fixtures
This thread aims to help you plan and navigate your team through the opening set of fixtures from GW1 to GW6.
Contents
1. Enhanced Fixture Difficulty Rating (FDR) analysis
2. Attack
3. Defense
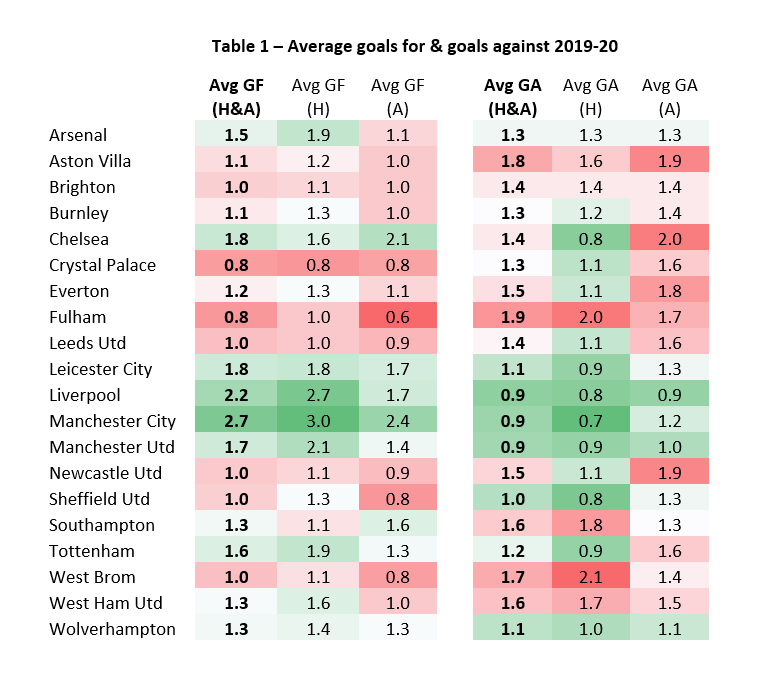
1.1) Instead of using the official FDR, I will use an enhanced version that distinguishes between attacking potential  & clean sheet potential
  for a given #FPL fixture. This is calculated using the goals for (GF) & goals against (GA) stats from the 2019-20 season.
 & clean sheet potential
  for a given #FPL fixture. This is calculated using the goals for (GF) & goals against (GA) stats from the 2019-20 season.
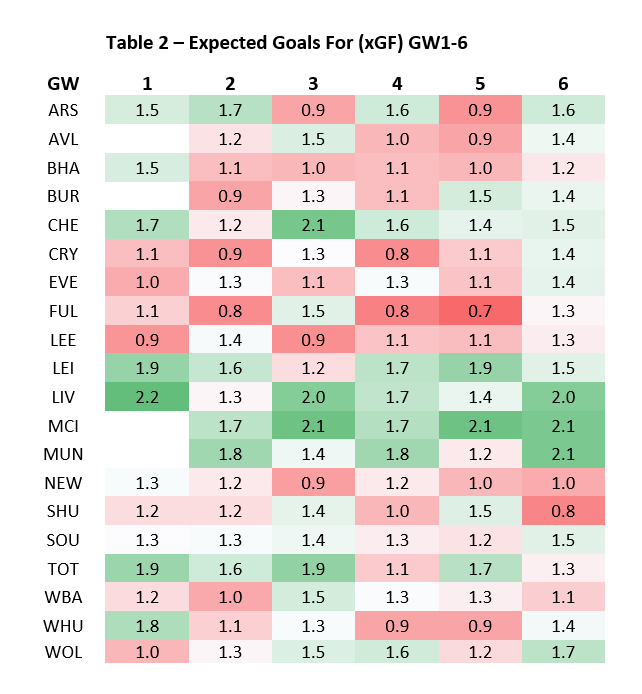
1.2) Expected Goals For (xGF) Table
xGF = Average (Team’s Avg Goals For (Home/Away adjusted), Opponent’s Avg Goals Against (Home/Away adjusted))
Example:
GW1 LIV v LEE
LIV Avg GF (Home) = 2.7
LEE Avg GA (Away) = 1.6
MCI xGF = Avg (2.7, 1.6) = 2.2
#FPL
xGF = Average (Team’s Avg Goals For (Home/Away adjusted), Opponent’s Avg Goals Against (Home/Away adjusted))
Example:
GW1 LIV v LEE
LIV Avg GF (Home) = 2.7
LEE Avg GA (Away) = 1.6
MCI xGF = Avg (2.7, 1.6) = 2.2
#FPL
1.3) This table will help you with your #FPL captaincy decision to identify which team will likely score the most goals in any given game week.
1.4) Expected Goals Against (xGA) Table
xGA= Average (Team’s Avg Goals Against (Home/Away adjusted), opponent Avg Goals For (Home/Away adjusted))
Example
GW1 LIV v LEE
LIV Avg GA (Home) = 0.8
LEE Avg GF (Away) = 1.0
MCI xGA=avg (0.63,1.68) = 0.9
#FPL
xGA= Average (Team’s Avg Goals Against (Home/Away adjusted), opponent Avg Goals For (Home/Away adjusted))
Example
GW1 LIV v LEE
LIV Avg GA (Home) = 0.8
LEE Avg GF (Away) = 1.0
MCI xGA=avg (0.63,1.68) = 0.9
#FPL
1.5) For the 3 promoted teams, stats from the 2019-20 Championship season were taken & adjusted by a discounted %. This is calculated by taking the average % change between promoted sides performance in the championship & their performance in the PL in the subsequent year.
#FPL
#FPL
1.6) It is important to acknowledge limitations in this methodology e.g. does not account for a change in manager & squads, top 6 performance vs non-top 6 performance, etc. This data should be used along with your other #FPL research to guide your decision making.
2.1) Using Table 4.1 & 4.2, we can identify the teams that will likely score the most goals between GW1-6.
Table 4.2 ranks the teams from highest to lowest cumulative xGF from GW1-6.
#FPL
Table 4.2 ranks the teams from highest to lowest cumulative xGF from GW1-6.

#FPL
2.2) LIV, LEI, TOT, & CHE top the tables for cumulative xGF for GW1-3, GW1-4, & GW1-5, GW1-6. Ensure you have attacking players from these sides starting from GW1. 
#FPL

#FPL
3.1) Meanwhile using Table 5.1 & 5.2, we can identify the teams that will likely concede the fewest goals between GW1-6. Table 5.2 ranks the teams from lowest to highest cumulative xGA from GW1-6. 

3.2) LIV, SHU, TOT, & WOL top the tables for cumulative xGA for GW1-4, & GW1-5, GW1-6. Ensuring you have defenders from these sides starting from GW1 will increase the likelihood of clean sheets throughout this period. 

If you enjoyed this thread and found this useful, a like  and a retweet
  would be much appreciated!
Follow me for more fixtures and form analysis throughout the #FPL season!
 and a retweet
  would be much appreciated!
 Follow me for more fixtures and form analysis throughout the #FPL season!

 Read on Twitter


