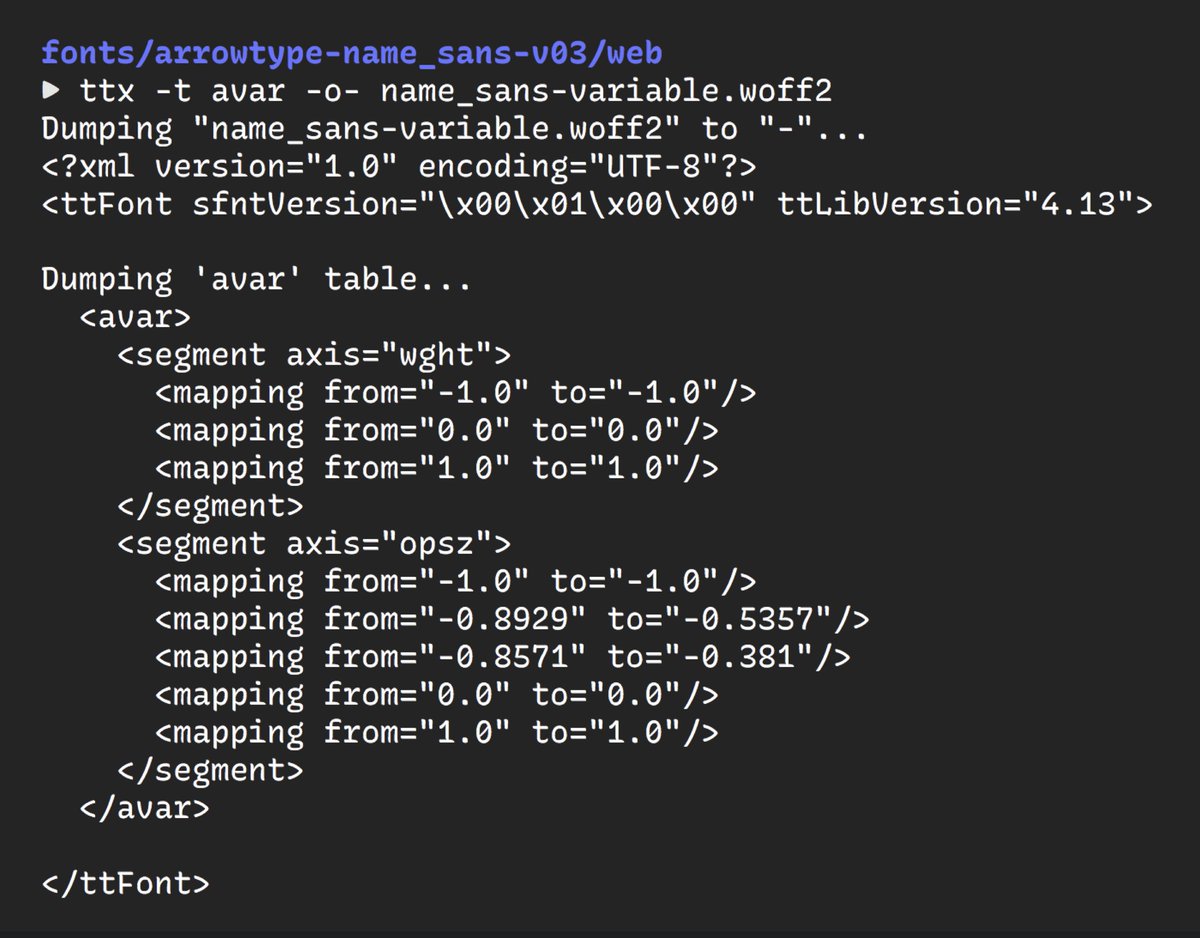
Font thread on axis mapping & optical sizes:
I received a question about testing mapped values in a variable font’s designspace, so I figured I should share the answer publicly, in case it’s helpful to others.
Question:
“How do you test axis mapping in a variable font?”
↓
I received a question about testing mapped values in a variable font’s designspace, so I figured I should share the answer publicly, in case it’s helpful to others.
Question:
“How do you test axis mapping in a variable font?”
↓
First, what is axis mapping?
It makes it possible for a font’s variable axis to have a non-linear effect on values.
E.g. in Name Sans, if you set opsz=24, the outlines you get are over halfway from min (12) to max (96).
The technical definition is at https://docs.microsoft.com/en-us/typography/opentype/spec/avar
It makes it possible for a font’s variable axis to have a non-linear effect on values.
E.g. in Name Sans, if you set opsz=24, the outlines you get are over halfway from min (12) to max (96).
The technical definition is at https://docs.microsoft.com/en-us/typography/opentype/spec/avar
Axis mapping also allows a designer to work in arbitrary units useful in their design workflow, but still build a font that follows OpenType conventions.
For example, here’s the map for the Weight axis in Recursive.
The axis tag and “input” values are what a user sees.
The “output” values are the values I use in the rest of this designspace file (a file that configures the source & output details for building fonts).
The axis tag and “input” values are what a user sees.
The “output” values are the values I use in the rest of this designspace file (a file that configures the source & output details for building fonts).
(Those “output” values are roughly equal to stem widths in Recursive in the Light, ExtraBold, and Heavy sources, by the way, though with a few tweaks to achieve the curve I wanted.)
The input/output labels always confuse me, so I often end up referring to old designspace files when I’m making or editing a new one.
More to the point of the original question:
How can this mapping be tested?
Luckily, there is Samsa by @Lorp!
If you do any web code, it’s a bit like “Dev Tools” for fonts.
It does a lot of cool things, like showing the paths that each point takes along variable axes.
How can this mapping be tested?
Luckily, there is Samsa by @Lorp!
If you do any web code, it’s a bit like “Dev Tools” for fonts.
It does a lot of cool things, like showing the paths that each point takes along variable axes.
It has a few extra handy features, however.
For instance, it shows a really good visual of axis mapping.
Better yet, if you hover on that, it tells you the exact “input” and “output” values!
Here in Name Sans, you can see that a user input of 24 yields a font output of 64.
For instance, it shows a really good visual of axis mapping.
Better yet, if you hover on that, it tells you the exact “input” and “output” values!
Here in Name Sans, you can see that a user input of 24 yields a font output of 64.
Side note: *why* is there axis mapping in the Optical Sizing of Name Sans, you might ask?
Fonts need more spacing to be readable at small sizes, and this need has an exponential curve.
You need a little change from size 96 to 24, but you need a lot of change from 24 to 12.
Fonts need more spacing to be readable at small sizes, and this need has an exponential curve.
You need a little change from size 96 to 24, but you need a lot of change from 24 to 12.
(I will further test and refine the specifics of this axis mapping in future versions of Name Sans. A current issue in the Optical Size axis means that it is only an approximate measure right now, based on either pt or px, depending on who you ask  ) https://github.com/w3c/csswg-drafts/issues/4430
 ) https://github.com/w3c/csswg-drafts/issues/4430
There is probably way more that could be said about this topic, but hopefully, a few people find that useful (or at least entertaining).
If I’ve said anything incorrect here, I welcome corrections in replies. I’ll add useful points to the thread if they come up!
If I’ve said anything incorrect here, I welcome corrections in replies. I’ll add useful points to the thread if they come up!

 Read on Twitter


