Why DHEC should a do better job at reporting COVID19 numbers and provide us with underlying dashboard data. A thread:
#sctweets #scnews #sc #southcarolina #dhec #covid19
#sctweets #scnews #sc #southcarolina #dhec #covid19
(2/x) A little background,, DHEC has several ways of reporting COVID19 data, as far as I know. Last Tuesday, DHEC released a new dashboard with granular county level data. Most of what I reference in this thread is found here. https://public.tableau.com/profile/population.health.dhec#!/vizhome/MainDashboard_15964746061440/HomePage
(3/x) Another data source I'll use for this is the DHEC daily news release for each day during this pandemic.
You can find a lot of this data and more here in this spreadsheet that @realTiffyCat helped me make! https://docs.google.com/spreadsheets/d/157AnQW6Bc02WKu44vh4W8B_W018ajXJwE5uMAx6-JFM/edit?usp=sharing
You can find a lot of this data and more here in this spreadsheet that @realTiffyCat helped me make! https://docs.google.com/spreadsheets/d/157AnQW6Bc02WKu44vh4W8B_W018ajXJwE5uMAx6-JFM/edit?usp=sharing
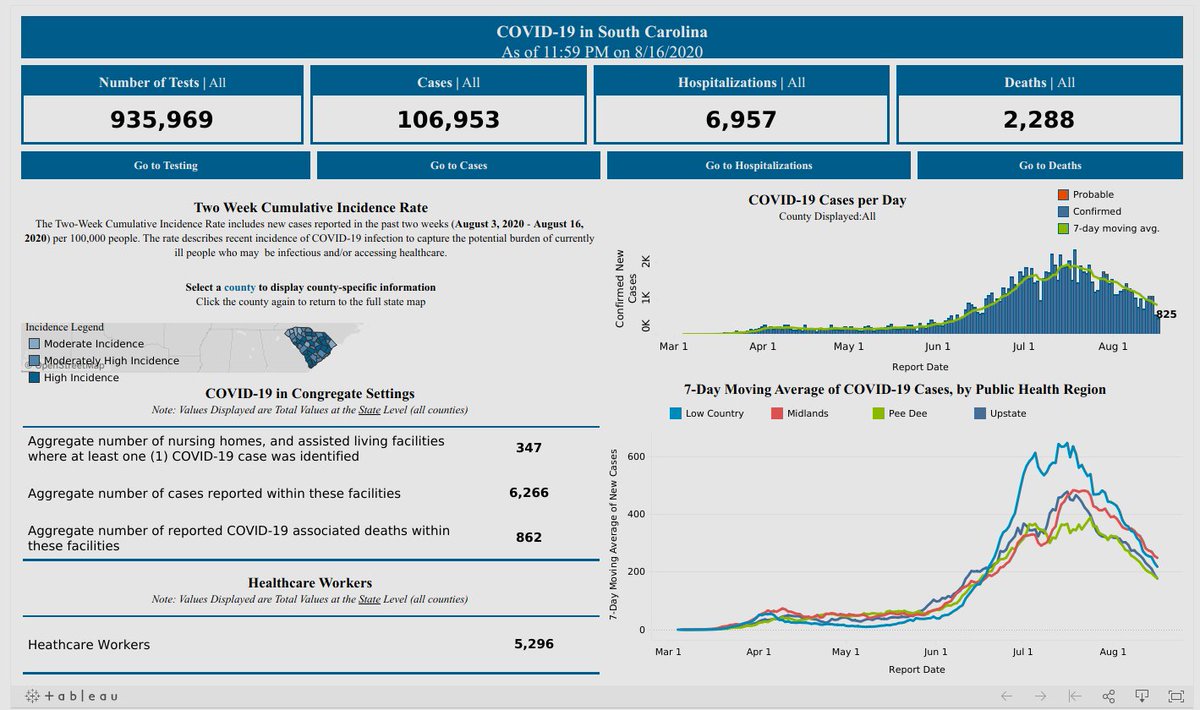
(4/x) So to begin, this new dashboard is DHEC's way of providing localized data for each county, but when opening the dashboard it provides a user with the daily cases per day for the state as shown here.
(5/x) CASES
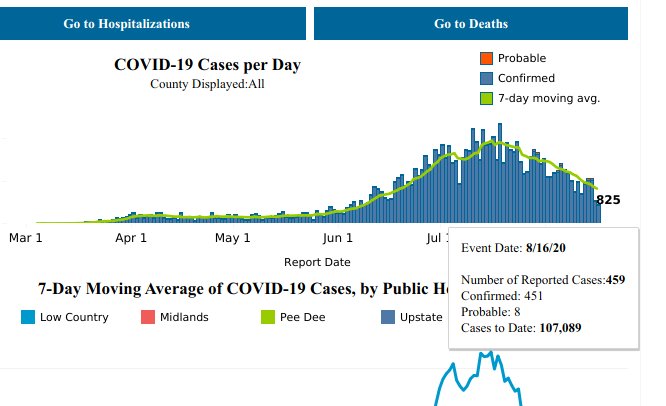
Note the cases box on the left hand side of the previous photo says 106,953 cases have been recorded in SC, but upon further inspection by hovering over the graph we see that number is actually higher at 107,889 cases.
Note the cases box on the left hand side of the previous photo says 106,953 cases have been recorded in SC, but upon further inspection by hovering over the graph we see that number is actually higher at 107,889 cases.
(6/x) A little under 1000 cases are missing, and it's difficult to pinpoint the general time frame in which those cases were recorded because in order to find out the cases each day, a user has to hover over every single bar on that plot. More explanation on the next tweet.
(7/x) Utilizing DHEC's the confirmed cases from each bar, I found that there are 105,905 confirmed cases in SC. That's about 1000 lower than the dashboards case number. I thought this was a data entry error, but after using DHEC's GIS teams open data API, I confirmed it.
(8/x) This dataset can be found here. To calculate daily case totals for SC, I sum each county's totals for a single day together. Then I sum each day together to get a cumulative total.
(9/x) TESTING
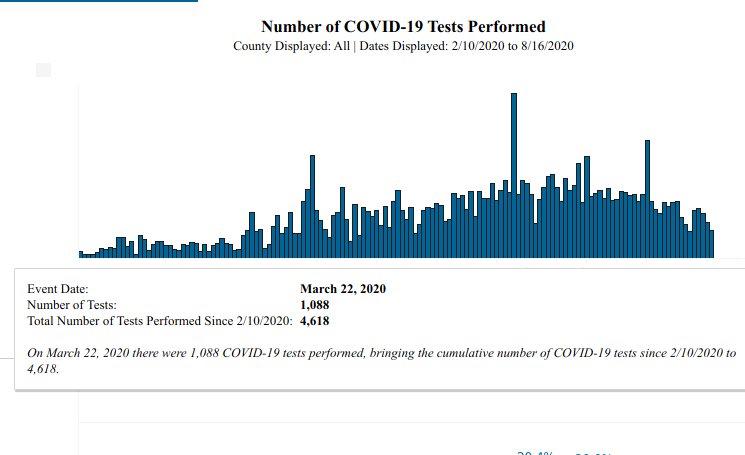
The new dashboard is an absolute mess when it comes to testing. It's missing all the testing numbers before March 22nd. According to the dashboard, there were 3530 tests done before March 22nd in SC. That's issue # 1 with testing, we're about to dive a little deeper
The new dashboard is an absolute mess when it comes to testing. It's missing all the testing numbers before March 22nd. According to the dashboard, there were 3530 tests done before March 22nd in SC. That's issue # 1 with testing, we're about to dive a little deeper
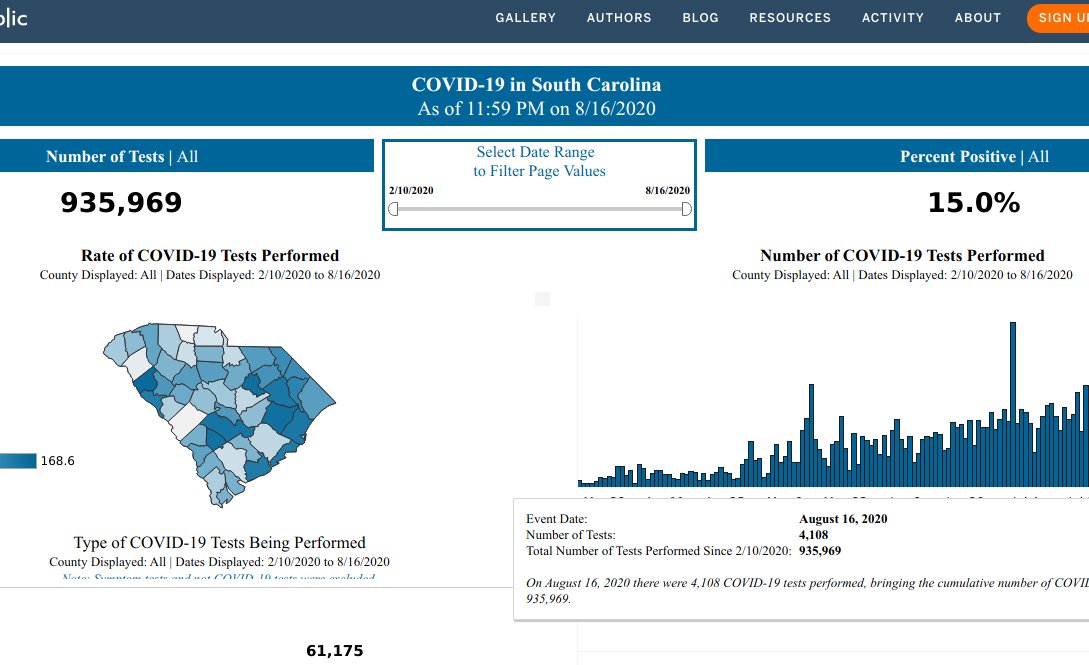
(10/x) Naturally, after noticing this, I wanted to see if the cumulative testing numbers from the dashboard lined up. So? It looks like they do, but wait... there's more on the dashboard that we need to look at.
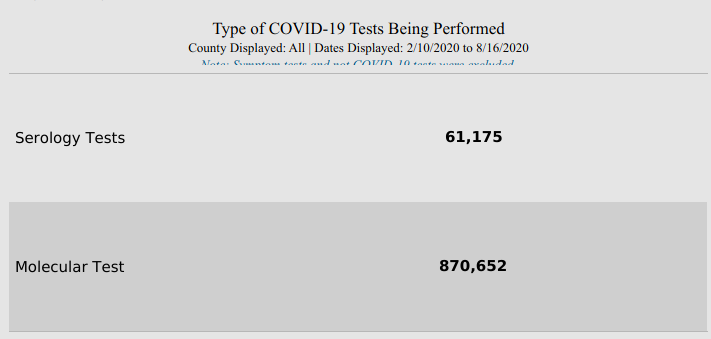
(11/x) This is on the testing dashboard, and these two numbers add up to 931,827 tests. That's not good because the number of tests listed in the top left hand corner of the dashboard is a little over 22,000 higher than the combined number of these two.
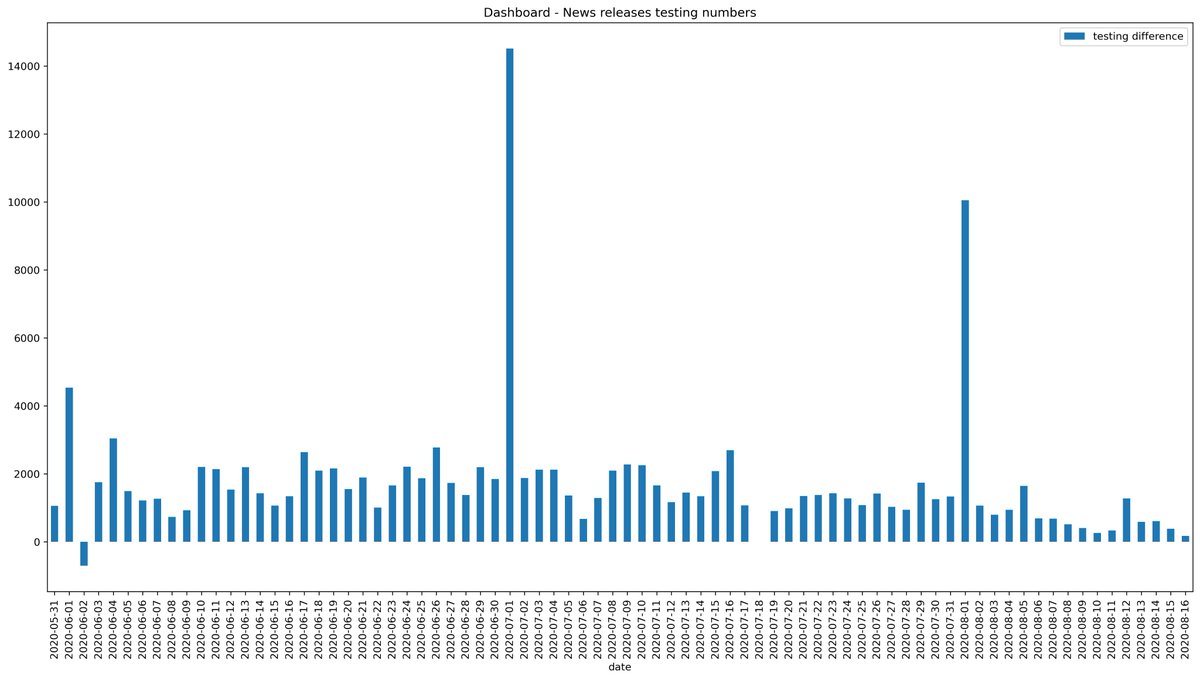
(12/x) Last look directly at testing. Let's look at the difference between the dashboard and the news releases when it comes to testing. Here's a plot of the daily difference between the dashboard and the news releases. If a day is blank, it's missing data.
(13/x) My first thought is: well maybe these tests on the dashboard are a combination of serology and molecular tests but it's not clear and DHEC doesn't specify, so we're left guessing.
% positive is unclear as well and I discuss this next
% positive is unclear as well and I discuss this next
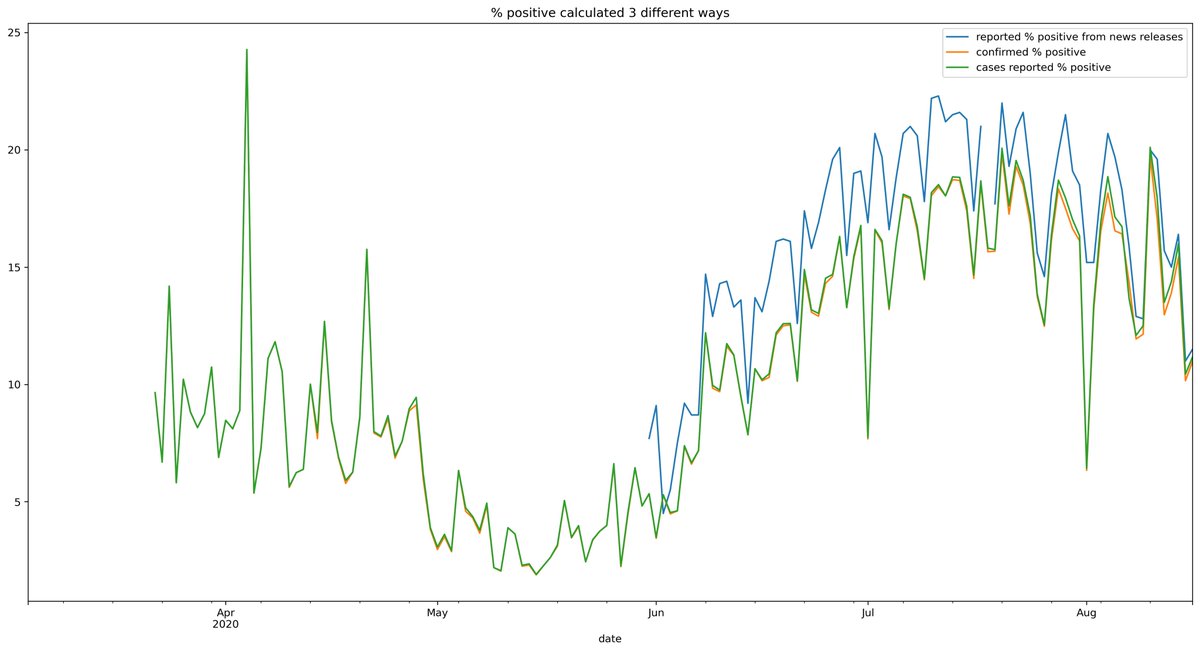
(14/x) So, let's take a look at how murky SC's % positive is.
DHEC's dashboard doesn't specify how percent positive is calculated. So that left me with several ways to interpret it. I've plotted each of them here, you can find the data in the Google spreadsheet from earlier
DHEC's dashboard doesn't specify how percent positive is calculated. So that left me with several ways to interpret it. I've plotted each of them here, you can find the data in the Google spreadsheet from earlier
(15/x)
I would like DHEC to address these issues and also provide access to the underlying data for the dashboard. I'm incredibly frustrated by what I've found and I'm sure others will be too.
I would like DHEC to address these issues and also provide access to the underlying data for the dashboard. I'm incredibly frustrated by what I've found and I'm sure others will be too.
(16/x)
so @scdhec, now's the time to answer my questions, and I'm doing this so you have a chance to set the record straight publicly.
If anyone else has questions, leave them here, and I'll try to get answers for you!!
so @scdhec, now's the time to answer my questions, and I'm doing this so you have a chance to set the record straight publicly.
If anyone else has questions, leave them here, and I'll try to get answers for you!!

 Read on Twitter