1/ For those interested in trying to follow what is going on at the Three Gorges Dam, this thread contains a few useful links and some basic interpretations. #ThreeGorgesDam
2/ First some disclosures. This isn't my area of expertise. Everything I know about the dam I learned from the internet. It is my expectation (and hope) that the dam holds. I became interested in the story because of the sheer volume of flooding in China this year.
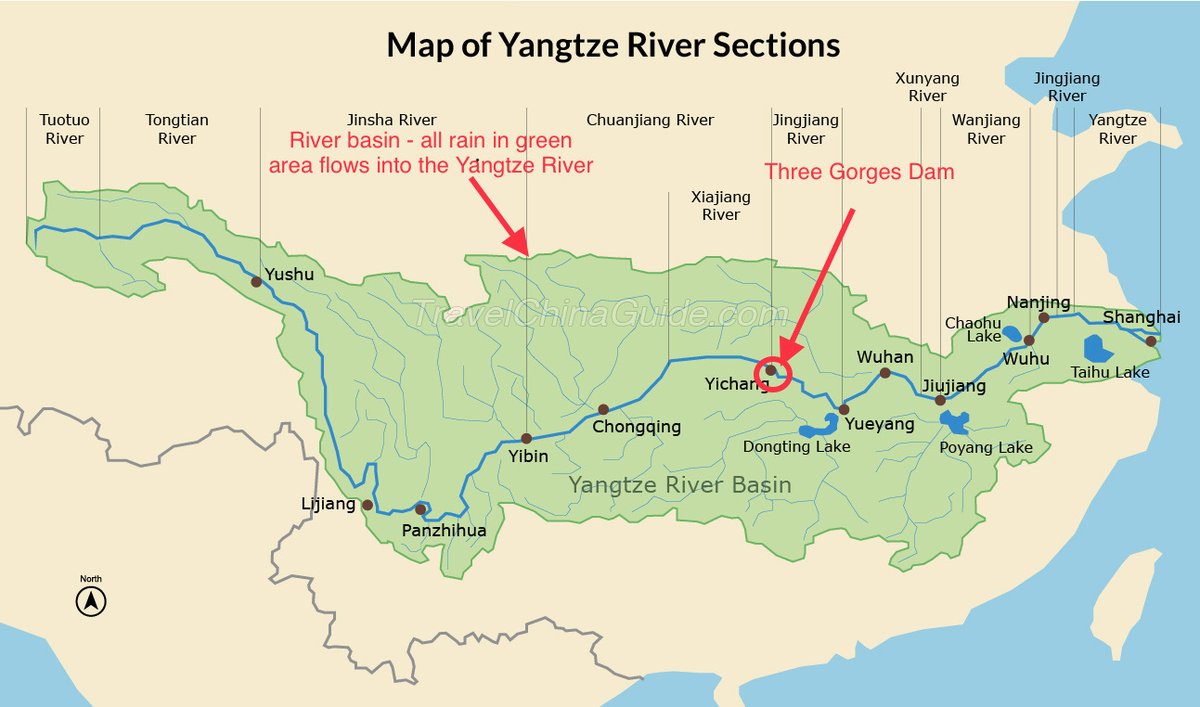
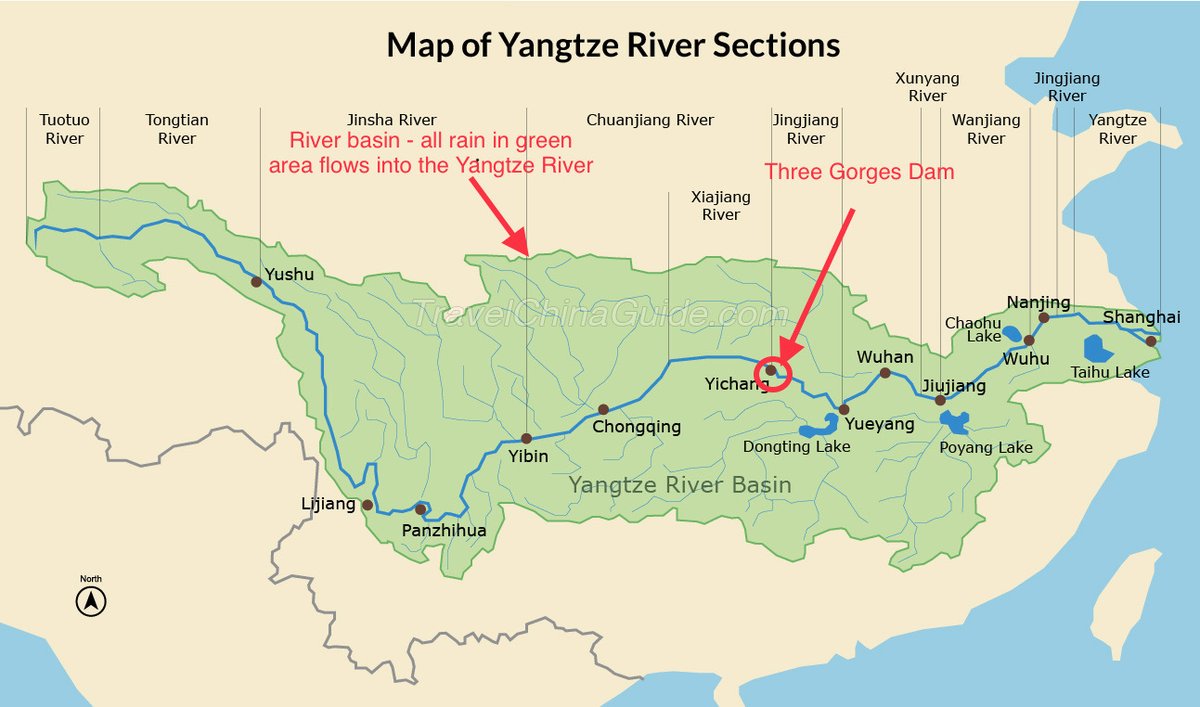
3/ Now some basics. The Three Gorges Dam is HUGE. It sits on the Yangtze River near Yichang. The Yangtze River flows west to east, exiting out to sea at Shanghai. Broadly, rainfall "upstream" of the dam means west of Yichang within the river basin, which is mapped in green.
4/ That last point is worth expanding. The river basin defines where rainfall ultimately finds its way to the Yangtze River. For example, if a massive rainstorm hits north or south of Chongqing, that water will eventually feed into the Yangtze River and build up behind the dam.
5/ With that knowledge, when I see reports of massive rainfall and/or videos of flooding in China, I google the location and see whether it is upstream or downstream of the dam.
6/ The CCP puts out detailed 'official' flood information, including water flow and level data at various points along the Yangtze. An excellent summary of this data can be found here:
http://3gd.mooo.com
There is some skepticism of the data, but it is the best available.
http://3gd.mooo.com
There is some skepticism of the data, but it is the best available.
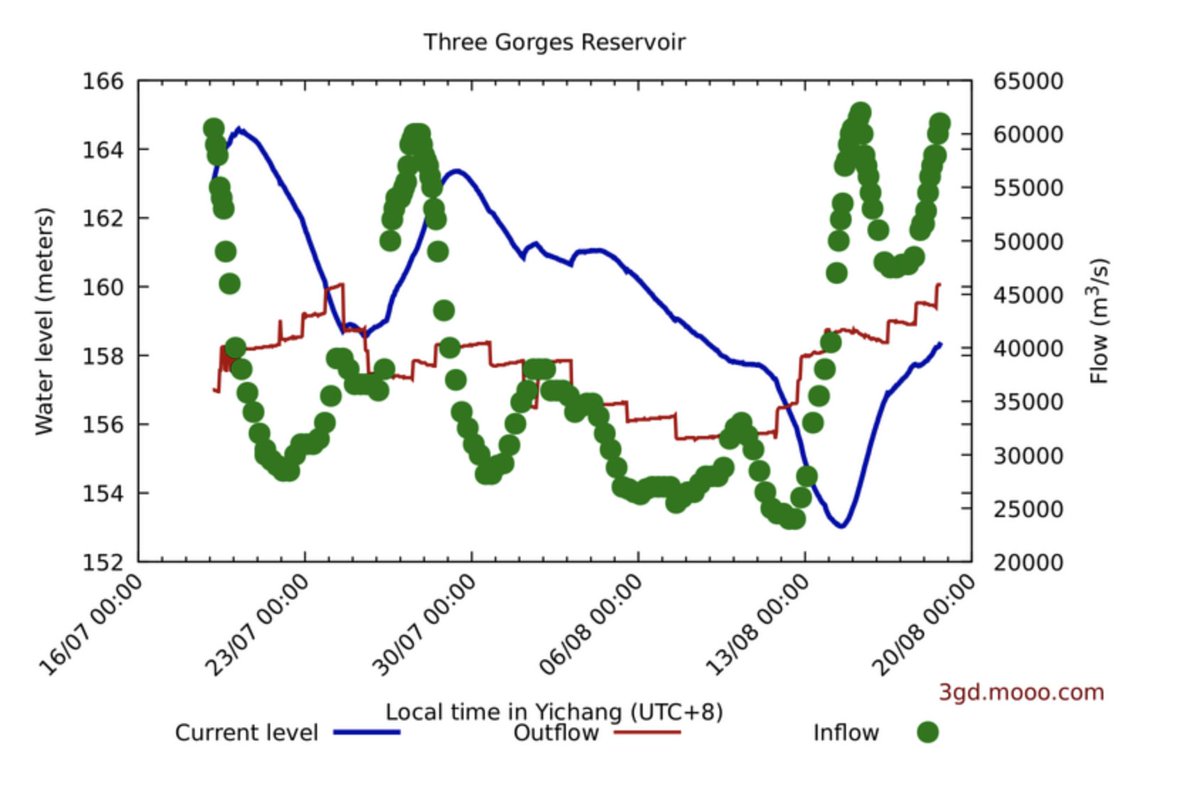
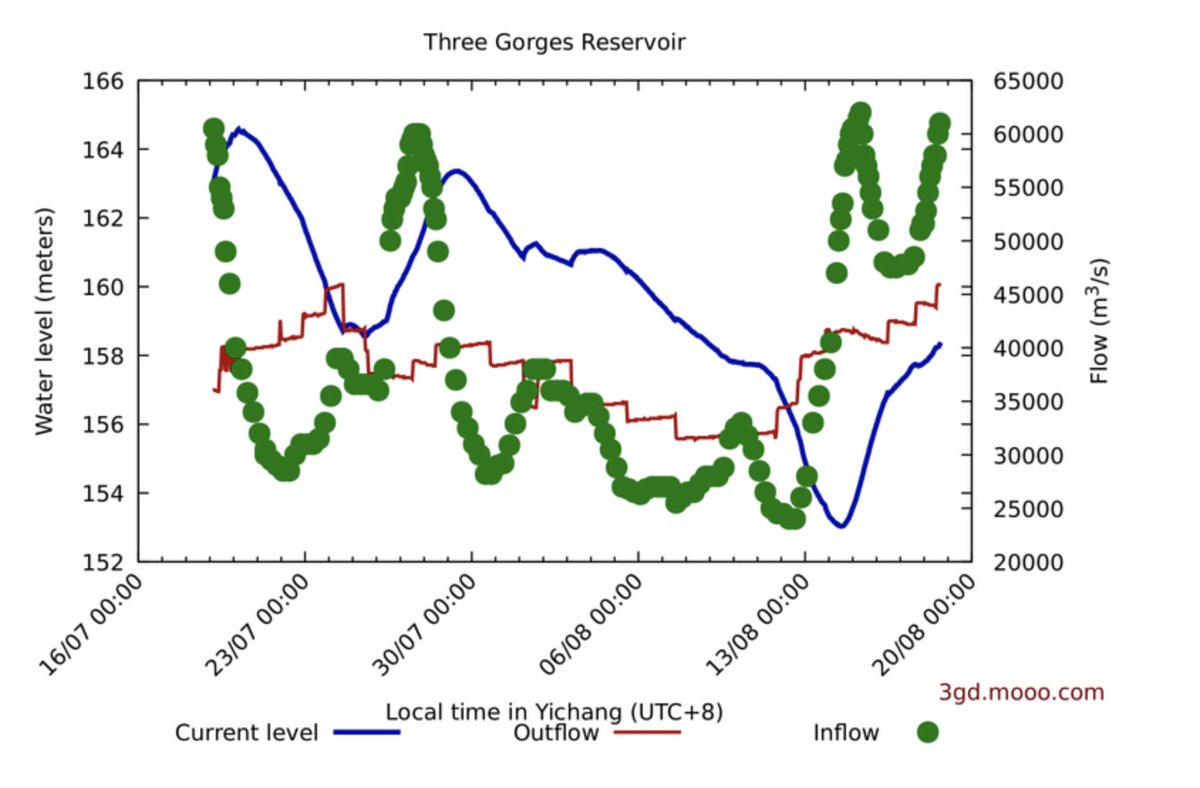
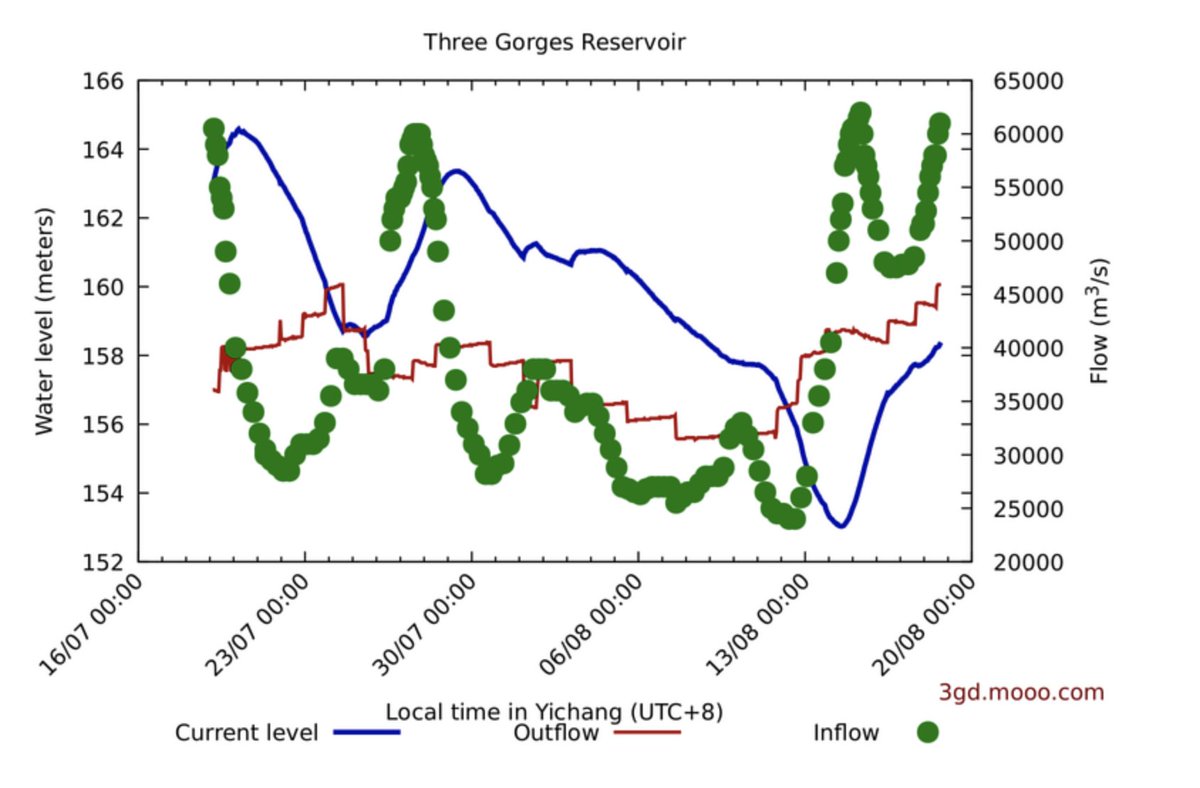
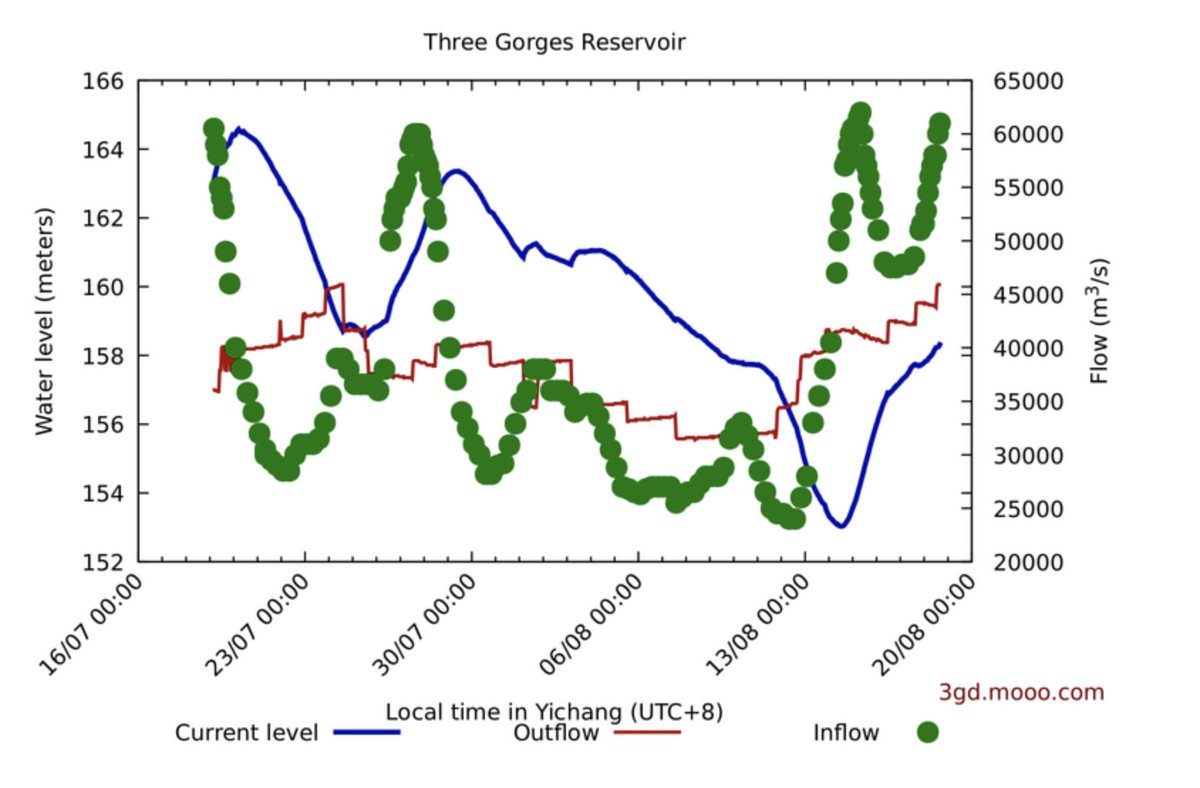
7/ The first chart from that link is worth studying. The solid blue line is the water level behind the dam. The solid red line is the rate at which water is being released from the dam, and the green dots are the rate at which water is flowing in behind the dam from the basin.
8/ Obviously, when the green dots are higher than the red line, the inflow behind the dam is greater than the outflow from it, and the water level behind the dam increases. The reverse is also true.
9/ It should be noted that the red line is a political decision of the CCP (within the constraints of the dam's ability to discharge water). People living upstream of the dam want more water to be released from it, people living downstream would prefer less, all things equal.
10/ You'll notice that a few days ago, after massive (biblical!) rains behind the dam, the CCP began to substantially increase the outflow from the dam ahead of the incoming flood. They had previously brought water levels down to ~153m.
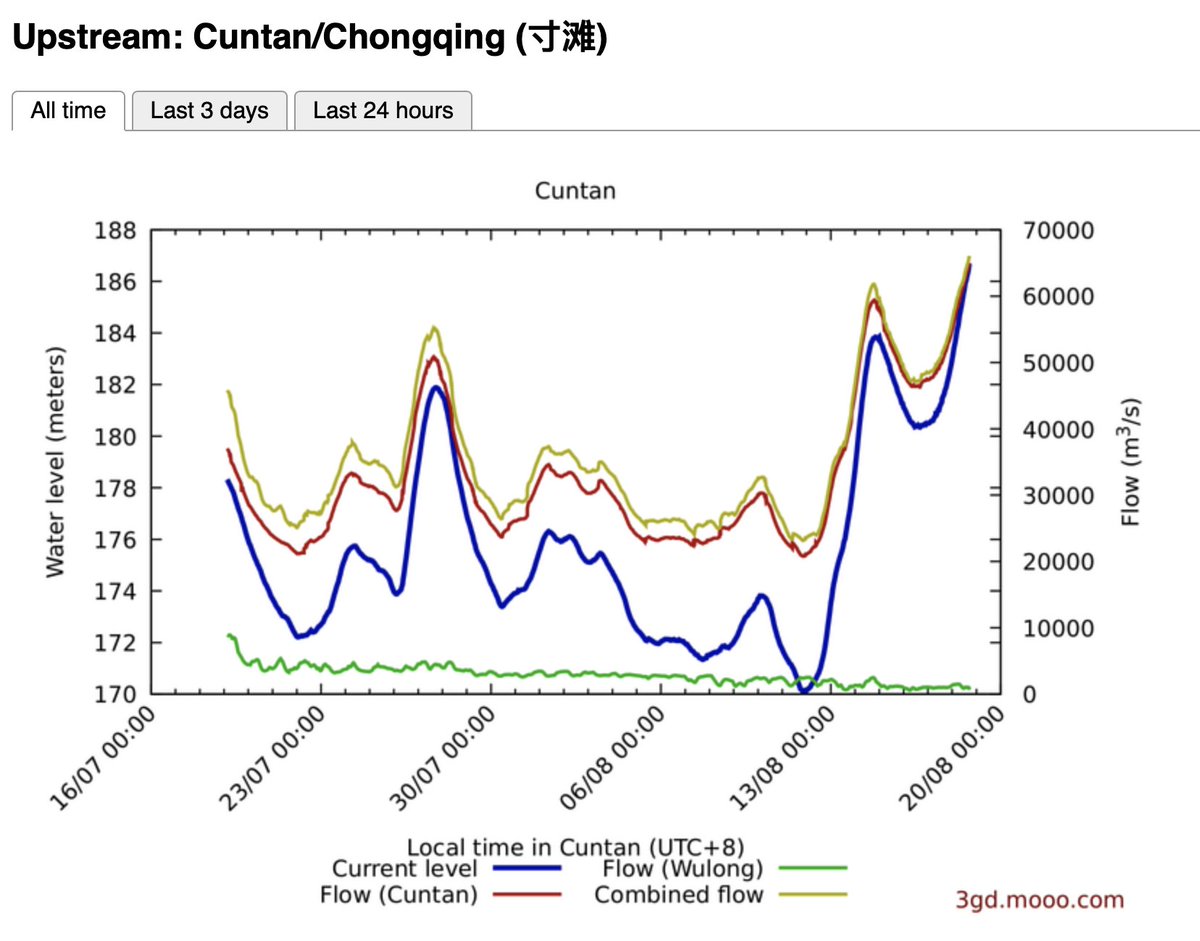
11/ The next chart you'll find on that link is a measure of water levels upstream in Cuntan. It is currently setting records for water level and flow - this water will flow to the Three Gorges Dam soon.
12/ To get a sense of the relevant rainfall, I check the satellite information for Chengdu using this link. You can easily zoom in and out to gauge overall conditions. https://www.accuweather.com/en/cn/chengdu/106774/satellite/106774
13/ There are lots of YouTube videos of varying quality covering the topic. One interesting link is the China playlist from Gorilla Forex Community, a series of more than 30 videos which can be found here: https://www.youtube.com/playlist?list=PLXl3kZk01ssSGnX7M1owwf7h61Cb5bnii
14/ Other things of note. There is some concern about the massive amount of debris and soot piling up behind the dam. There is some concern about earthquakes near the dam. There are conspiracies that claim the CCP is letting out more water at night. I find no good data on these.
15/ A good follow on the subject is @public_juan. You can find other accounts based on who that account interacts with if you are interested.
16/ There you have it. A starter's guide to the Three Gorges Dam. May the rains subside and the dam hold.
#ThreeGorgesDam
#ThreeGorgesDam

 Read on Twitter