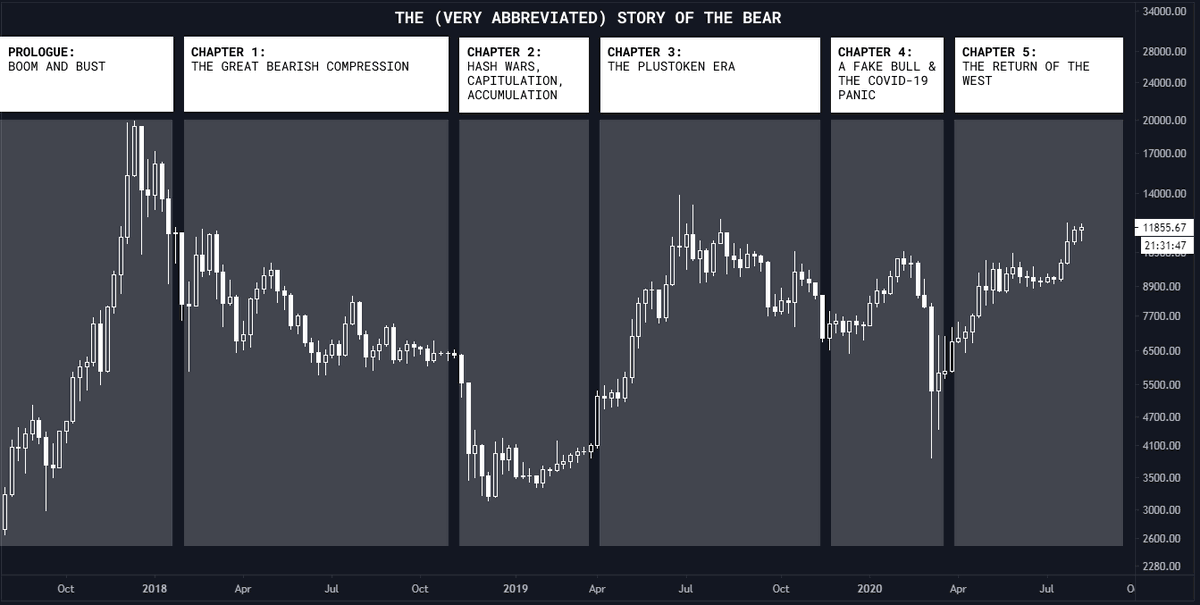
1) It has been a long road since the Bitcoin top of 2017. Herein, a nowhere-near complete summary of what has transpired.
Next below, a brief thread on few interesting tidbits. Shoutout to @whale_map for the innovative on-chain metrics.
Next below, a brief thread on few interesting tidbits. Shoutout to @whale_map for the innovative on-chain metrics.
2) Looking only a year and a half back, we had some of the most interesting market structures in any Bitcoin cycle. During several attempts at a "typical" bullish trend with a strong halving narrative, two swans hit price discovery one after the other: PlusToken and COVID-19.
3) MPL (read description on image) suggest crossover events where moving bitcoins at profit or loss diverge during bullish and bearish primary trends.
4) Zoomed-in MPL show just how atypical and chaotic 2019 and 2020 have been for Bitcoin. Major crossover events of such frequency are unprecedented in over 10 years.
5) CIH is the delta between two volume profiles (in this case from 2018 onward): bitcoins unmoved (assumed as hodling) and bitcoins moved (assumed as distribution). Three levels of major buyouts are noticeble—two remain as major demand zones; one as a last major resistance.
6) Finally, unspent whale clusters confirm a great battle taking place. Two actors at play: top buyers at 12k-14k reaching their breakeven price, and current buyers active after the first higher high in over a year.
7) If we get a correction, it will most likely result in another major cluster of re-accumulation at the 10k area (as expected from the volume profile before); if we breakout, well, fuck... enjoy the ride.

 Read on Twitter


