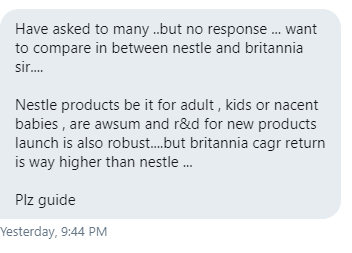
Me-> Both are great companies.
1) Britannia Sales & Profit growth CAGR has been better than Nestle for last 11 yrs.
2) Operating Profit Margin of Nestle though is better than Britannia but at same time it has been range-bound (19% to 23%)...
2/n
1) Britannia Sales & Profit growth CAGR has been better than Nestle for last 11 yrs.
2) Operating Profit Margin of Nestle though is better than Britannia but at same time it has been range-bound (19% to 23%)...
2/n
3) In 2009 Nestle OPM was 19% & now in 2020 it is 23%.
Britannia it has increased from 6% (2009) to 18% (2020).
Did you see ?
OPM of Britannia has continuously increased at a higher multiple. It tripled.
3/n
Britannia it has increased from 6% (2009) to 18% (2020).
Did you see ?
OPM of Britannia has continuously increased at a higher multiple. It tripled.
3/n
4) What does it mean ?
It means Britannia was able to pass cost increase to customers easily or was able to raise its product prices or was able to procure raw materials in lower prices or all of these.
4/n
It means Britannia was able to pass cost increase to customers easily or was able to raise its product prices or was able to procure raw materials in lower prices or all of these.
4/n
5) Another very important factor is EPS growth.
Nestle has EPS of 48.17 (2009) which increased to 215 (2020) means around 4.5 times. If you see Britannia it was 2.83 & increased to 70.59 in same period.
So whooping 25 times.
6) Britannia grew from a smaller base too.
5/n
Nestle has EPS of 48.17 (2009) which increased to 215 (2020) means around 4.5 times. If you see Britannia it was 2.83 & increased to 70.59 in same period.
So whooping 25 times.
6) Britannia grew from a smaller base too.
5/n

 Read on Twitter


