Winning margins in 2020 from Rd 3 to Rd 13
Games won: 87
Rd 3: 146 @ 20.86
Rd 4: 153 @ 19.13
Rd 5: 111 @ 13.86
Rd 6: 108 @ 13.50
Rd 7: 143 @ 17.88
Rd 8: 111 @ 13.86
Rd 9: 130 @ 16.25
Rd 10: 148 @ 18.50
Rd 11: 92 @ 11.50
Rd 12: 74 @ 9.25
Rd 13: 139 @ 17.38
TOTAL: 1355 @ 15.57
Games won: 87
Rd 3: 146 @ 20.86
Rd 4: 153 @ 19.13
Rd 5: 111 @ 13.86
Rd 6: 108 @ 13.50
Rd 7: 143 @ 17.88
Rd 8: 111 @ 13.86
Rd 9: 130 @ 16.25
Rd 10: 148 @ 18.50
Rd 11: 92 @ 11.50
Rd 12: 74 @ 9.25
Rd 13: 139 @ 17.38
TOTAL: 1355 @ 15.57
Furthermore, the concept of cherry picking rather specific data and comparing it with much larger datasets is quite ingenuine and can be misleading.
If we have to compare Rd 3 to Rd 13 with past seasons, then make it the same Round range for every year. Still flimsy, but less so
If we have to compare Rd 3 to Rd 13 with past seasons, then make it the same Round range for every year. Still flimsy, but less so
Highest Avg winning margin for Rd 3 to Rd 13 since 1998
2002 - 16.97
2010 - 16.13
2005 - 16.11
1998 - 15.95
2020 - 15.57
2001 - 15.51
2004 - 15.00
Hardly anything to hang your hat on for an opinion piece.
Definitely not the biggest in competition's history.
2002 - 16.97
2010 - 16.13
2005 - 16.11
1998 - 15.95
2020 - 15.57
2001 - 15.51
2004 - 15.00
Hardly anything to hang your hat on for an opinion piece.
Definitely not the biggest in competition's history.
In fact, if we take the cherry picked period of Rd 3 to Rd 13 and compare it to the average winning margin from each year of the competitions history, we will find it's not the highest.
1935 had an average of 19.96
1995 had an average of 18.19
That's without checking every year
1935 had an average of 19.96
1995 had an average of 18.19
That's without checking every year
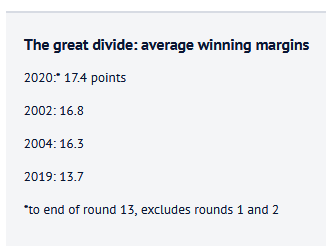
While I'm at it. The article also states that the average winning margin since 1998 was in 2002 at 16.8.
It was 17.3
They've included draws to reach 16.8.
Why would you include draws when calculating winning margins? That is selective stats use to push an agenda.
It was 17.3
They've included draws to reach 16.8.
Why would you include draws when calculating winning margins? That is selective stats use to push an agenda.
Continuing on.
The average winning margin of 2019 was 13.79
The average winning margins from Rd 3 to Rd 13 this year is 15.57 - up by 1.78 on last year - less than a penalty goal.
Not 'almost an unconverted try'
The average winning margin of 2019 was 13.79
The average winning margins from Rd 3 to Rd 13 this year is 15.57 - up by 1.78 on last year - less than a penalty goal.
Not 'almost an unconverted try'
Being really picky here, but fuck it.
Average winning margin over the last 2 years is 14.73
And for the hell of it the average since 4 pt tries came in is 14.42
And the average since 1908 is 13.01
So Rd 3 to Rd 13 is only 2.56 points up - still not 'almost an unconverted try'
Average winning margin over the last 2 years is 14.73
And for the hell of it the average since 4 pt tries came in is 14.42
And the average since 1908 is 13.01
So Rd 3 to Rd 13 is only 2.56 points up - still not 'almost an unconverted try'
One more thing. Avg tries per game Since Rd 3 is 7.10 not 7.5
For 2020 the avg tries per game is at 6.88
In 2019 it was 6.64
Rd 3 to Rd 13 is up 0.46 on last year - not 0.6
For 2020 the avg tries per game is at 6.88
In 2019 it was 6.64
Rd 3 to Rd 13 is up 0.46 on last year - not 0.6
These corrections are all in relation to this article:
https://www.smh.com.au/sport/nrl/blowouts-reach-highest-point-in-nrl-history-20200815-p55m22.html
For further analysis, check out this awesome thread by @pythagoNRL (and give him a follow because he is fucking awesome) https://twitter.com/pythagoNRL/status/1294770449105080320
https://www.smh.com.au/sport/nrl/blowouts-reach-highest-point-in-nrl-history-20200815-p55m22.html
For further analysis, check out this awesome thread by @pythagoNRL (and give him a follow because he is fucking awesome) https://twitter.com/pythagoNRL/status/1294770449105080320

 Read on Twitter


