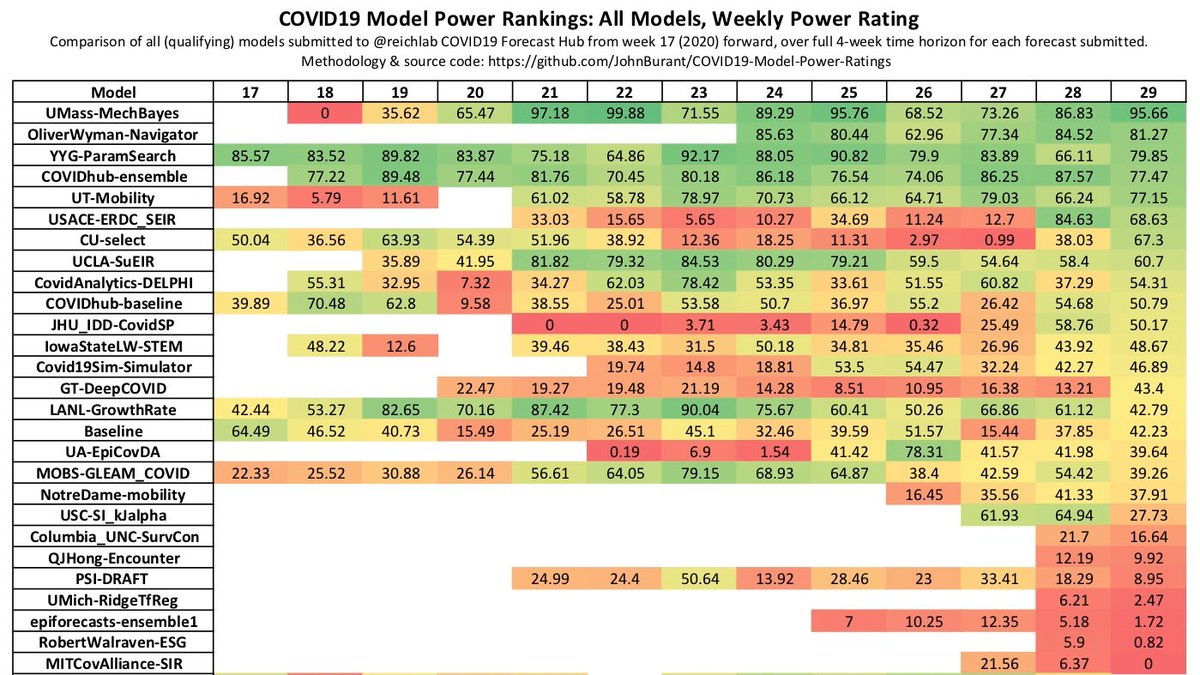
** Rating the COVID19 models **
What's the "best" (= most accurate) of the COVID19 models out there? How can we make consistent comparisons over time?
This thread discusses a (new) framework for comparing the models on the @reichlab and @CDCgov sites. 1/
What's the "best" (= most accurate) of the COVID19 models out there? How can we make consistent comparisons over time?
This thread discusses a (new) framework for comparing the models on the @reichlab and @CDCgov sites. 1/
3/ Quick summary of tables: Since models were collected beginning back in April 2020 through to the forecasts submitted in week 29 (week starting 2020-08-12):
@youyanggu’s YYG-ParamSearch model has been the most accurate model.
@youyanggu’s YYG-ParamSearch model has been the most accurate model.
4/
@reichlab’s COVIDhub-ensemble model has been the 2nd most accurate model.
@OliverWyman’s Pandemic Navigator model has been the 3rd most accurate model (though notably its forecast history goes back only 6 weeks, in comparison with 12 weeks for COVIDhub-ensemble and
@reichlab’s COVIDhub-ensemble model has been the 2nd most accurate model.
@OliverWyman’s Pandemic Navigator model has been the 3rd most accurate model (though notably its forecast history goes back only 6 weeks, in comparison with 12 weeks for COVIDhub-ensemble and
5/ 13 weeks for YYG-ParamSearch.
Another notable finding: The @IHME_UW model, which has received a substantial amount of media and government attention, has managed a lifetime record of being slightly *less accurate than median* model on the COVID19 Forecast Hub.
Another notable finding: The @IHME_UW model, which has received a substantial amount of media and government attention, has managed a lifetime record of being slightly *less accurate than median* model on the COVID19 Forecast Hub.
6/ That’s a good segue to the how the ratings are calculated and what they mean. Summary in the thread, or click through to longer exposition of rationale, method, and full results: https://github.com/JohnBurant/COVID19-Model-Power-Ratings
7/ The ratings are all based on the core measurement of the Forecast Hub, which is death counts. The key strength of the “power rating” is that it determines a single (unitless) numerical rating on a consistent scale for any chosen set of models, error measures, time frame and
8/ forecast horizon. The numerical rating indicates exclusively *relative* accuracy of the models. Though it of course is based on an underlying assessment of absolute accuracy, its value does not float as the absolute accuracy of a group of models varies over time.
9/ The core concept is the “power rating,” which assigns a rating for each individual combination of model, forecast starting week, sequential week of the model forecast’s time horizon, and error measurement (a 4-tuple).
10/ Four error measurements are used: state-level mean absolute error, state-level root mean square error, state-level mean rank, and absolute percent national error.
For each 3-tuple of forecast starting week, sequential week and error measurement,
For each 3-tuple of forecast starting week, sequential week and error measurement,
11/ the raw errors of all models are transformed to the power rating on a proportional scale of 0 to 100, where 100 represents the lowest error, 50 represents the median error, and 0 represents an error twice the difference between the minimum error and the median error.
12/ The power ratings for each 4-tuple are then aggregated in various ways to provide, among other measures, the weekly and lifetime scores shown above. This also allows for some further analysis, for example:
13/ Some models are quite consistent in their power ratings across all these measures. The min-max spread for the UMass-MechBayes model on these four measures is only 6 points (out of 100) over its lifetime.
14/ In contrast, the Karlen-pypm model has achieved above-the-median ratings in projecting total national deaths, despite very low accuracy on the state-level measures.
15/ @youyanggu has, for the past several weeks, shared an assessment of these models based solely on how they perform in state-level absolute error at the four-week mark. As he’s stated, this single-point assessment does seem like a reasonable time point and measure to use.
16/ But what’s interesting here is that his model has generally been more accurate (compared with others) in earlier weeks (1, 2 and 3) than at the 4-week mark.
17/ For someone who both models and assesses, it shows intellectual honesty and an absence of self-promotion to pick a measure which isn’t necessarily the one on which one’s own model performs the best.
18/ (Also interesting: The IHME model has generally trended better over the four-week course of a forecast horizon.)
For full disclosure, I have also developed a model that I submit to the Forecast Hub, though this work is quite recent (earliest projections only 3 weeks ago).
For full disclosure, I have also developed a model that I submit to the Forecast Hub, though this work is quite recent (earliest projections only 3 weeks ago).
19/ In the early weeks, they’ve been quite accurate, but of course that could turn out not to be the case in future weeks. I do plan to continue to share power ratings in future weeks, and indeed my own model will appear (somewhere) on the list of results.
20/ But I thought it would be worthwhile to share this framework *before* my model forecasts have enough of a history to show any signal as to what makes them look better or worse, and before they merit inclusion on this power ratings list.
21/ (Partial) list of models evaluated:
@CovidActNow @predsci @ardenebaxter @JHIDDynamics @STHorstman @sangeeta0312 @meyerslab @covid_analytics @youyanggu @IHME_UW @LilyWan84496995 @jaradniemi @johannesbracher
@TAlexPerkins @alexvespi @sdelvall @SenPei_CU
@QuanquanGu
@CovidActNow @predsci @ardenebaxter @JHIDDynamics @STHorstman @sangeeta0312 @meyerslab @covid_analytics @youyanggu @IHME_UW @LilyWan84496995 @jaradniemi @johannesbracher
@TAlexPerkins @alexvespi @sdelvall @SenPei_CU
@QuanquanGu
23/ (very) partial list of others who (might) be interested: @_stah @zorinaq @ASlavitt @CT_Bergstrom @nataliexdean @DrTomFrieden @EricTopol @Bob_Wachter
END/ If you want to see further weekly updates, follow me here on twitter.

 Read on Twitter


