US Update: 8/8/2020
*4-Day Update
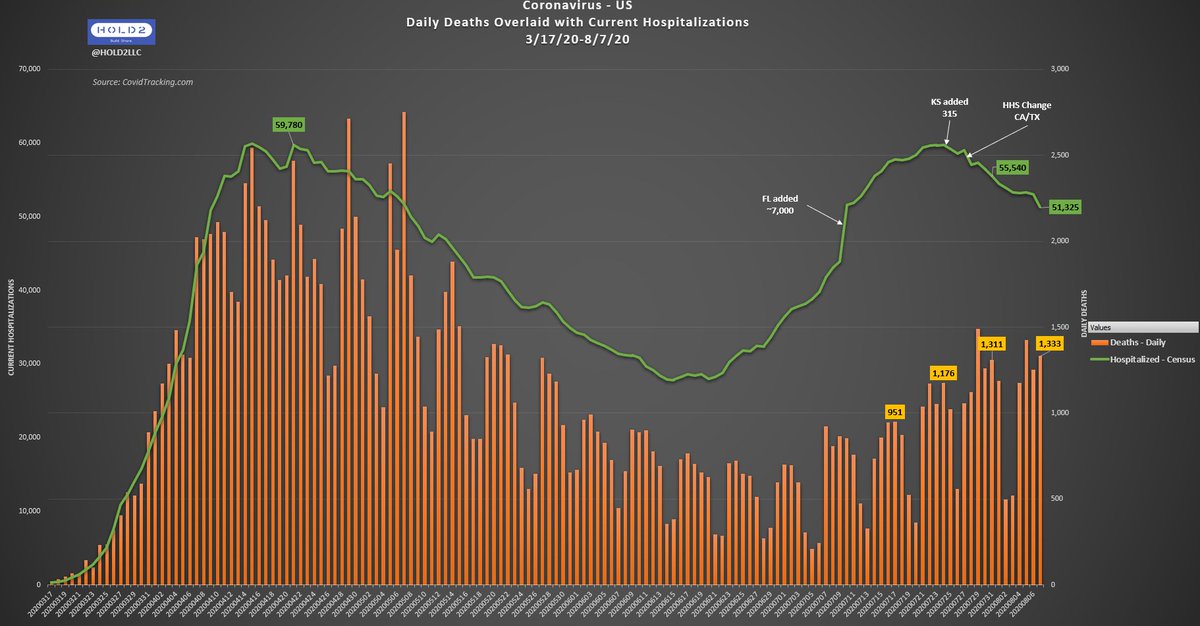
Graph 1: Daily Deaths + Current Hospitalizations
- Hosps falling rapidly and consistently
- Deaths up 22 W-o-W (mainly CA, WA, NC, LA)
Death increase has stalled and possibly peaked
/1
*4-Day Update
Graph 1: Daily Deaths + Current Hospitalizations
- Hosps falling rapidly and consistently
- Deaths up 22 W-o-W (mainly CA, WA, NC, LA)
Death increase has stalled and possibly peaked
/1
Graph 2: COVID ICU Census vs. Deaths (7DayAvg) vs. Daily Detected Cases
***Detected Cases down sharply and consistently
- 7-Day Death avg DOWN 62 W-o-W
- ICUs dropping faster now
Legacy death reporting from hot & cold states is slowing the nose-over but not stopping it
/2
***Detected Cases down sharply and consistently
- 7-Day Death avg DOWN 62 W-o-W
- ICUs dropping faster now
Legacy death reporting from hot & cold states is slowing the nose-over but not stopping it
/2
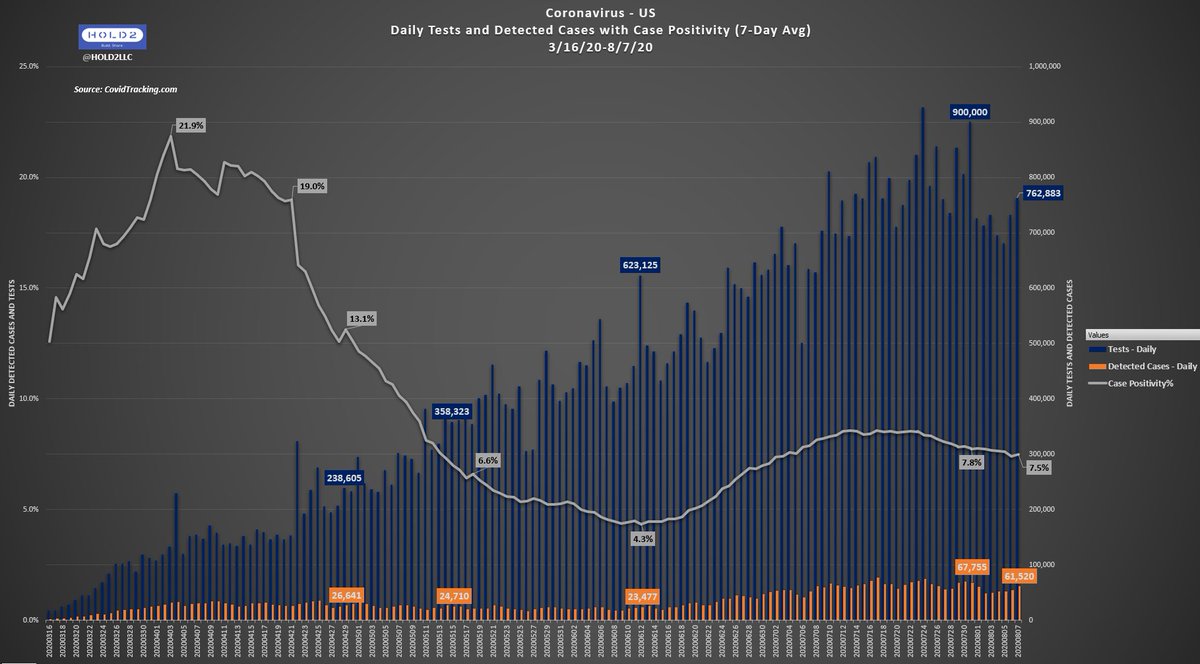
Graph 3: Daily Tests + Detected Cases + Case Positivity
***7-Day Case Pos% down 0.3% W-o-W
- Testing down 137k W-o-W (FL hurricane / CA/WA data issues)
- Detected Cases large drop by 6,235 W-o-W but same issues above
Testing a mess the past week, but Pos% decline is valid
/3
***7-Day Case Pos% down 0.3% W-o-W
- Testing down 137k W-o-W (FL hurricane / CA/WA data issues)
- Detected Cases large drop by 6,235 W-o-W but same issues above
Testing a mess the past week, but Pos% decline is valid
/3
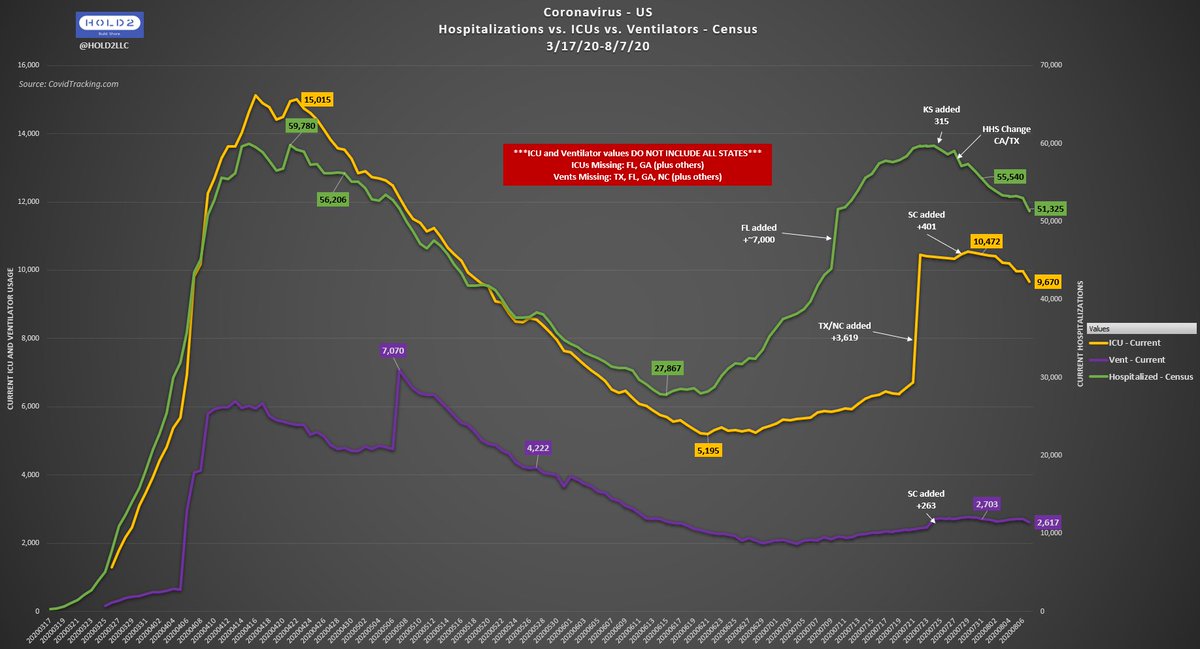
Graph 4: Coronavirus - Census for Hospitalizations vs. ICUs vs. Ventilators
***Dominoes falling faster
- Hosps DOWN 4,215 W-o-W
- ICUs DOWN 802 W-o-W
- Vents DOWN 86 W-o-W
Deaths certainly will go down accordingly
/4
***Dominoes falling faster
- Hosps DOWN 4,215 W-o-W
- ICUs DOWN 802 W-o-W
- Vents DOWN 86 W-o-W
Deaths certainly will go down accordingly
/4

 Read on Twitter


