What time is it?
Death time.
Death time.
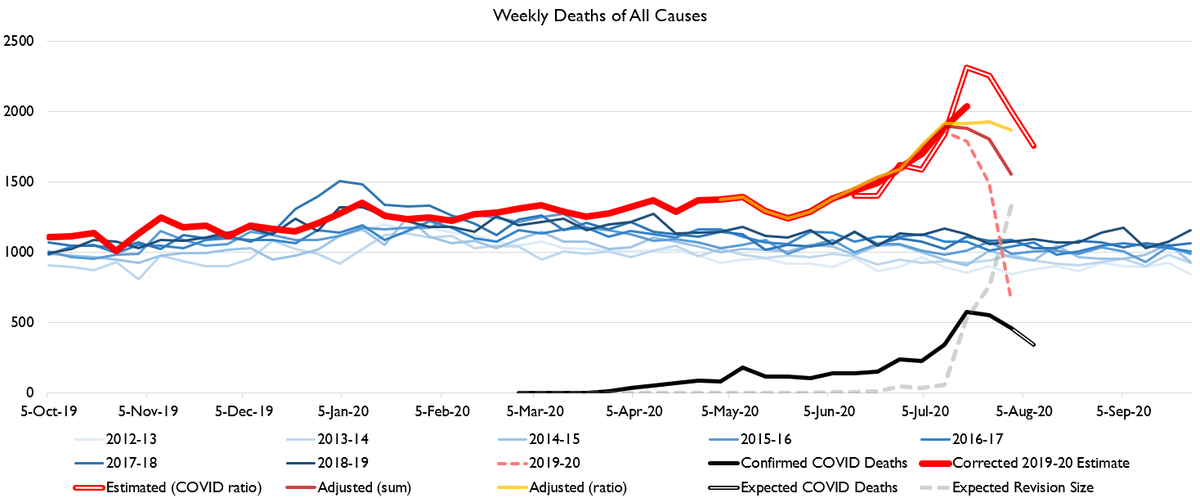
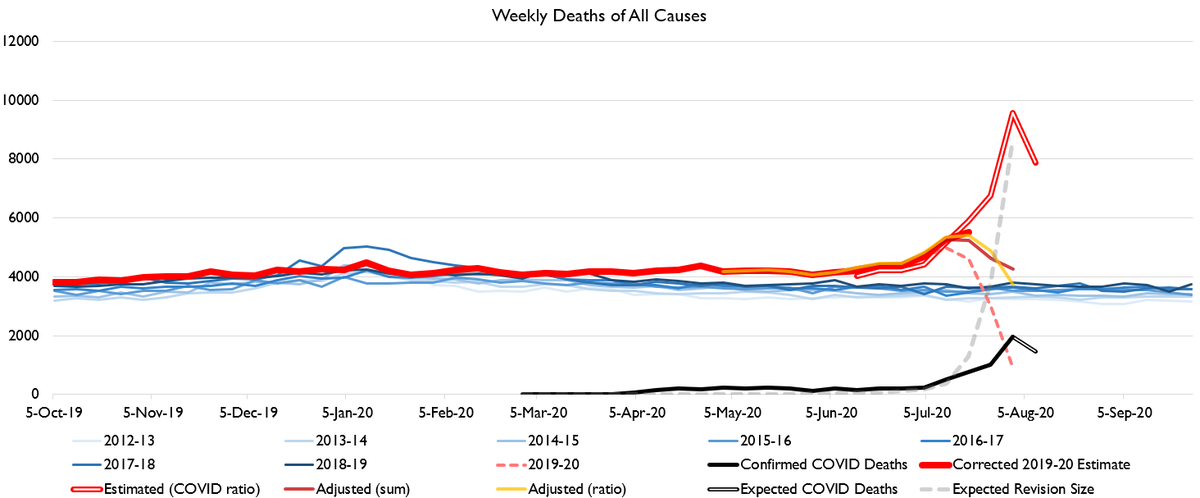
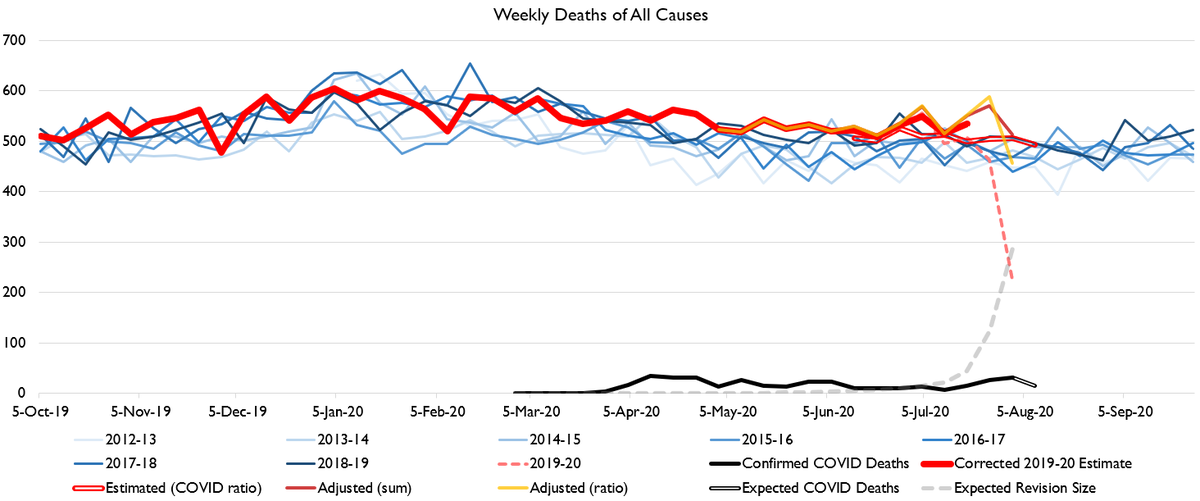
It appears that excess deaths may be peaking. Data next week should give us true confirmation of this. But as projected two weeks ago, falling caseloads are now resulting in falling official death counts.
my wife says my OP isn't funny and it makes me sound like I don't care.
I do care! But gallows humor is a necessity in these times.
I do care! But gallows humor is a necessity in these times.
Let me go ahead and offer the usual method notes.
CDC publishes raw mortality data organized by week of death (not week of death report received; week of *actual death*), available here: https://gis.cdc.gov/grasp/fluview/mortality.html
CDC publishes raw mortality data organized by week of death (not week of death report received; week of *actual death*), available here: https://gis.cdc.gov/grasp/fluview/mortality.html
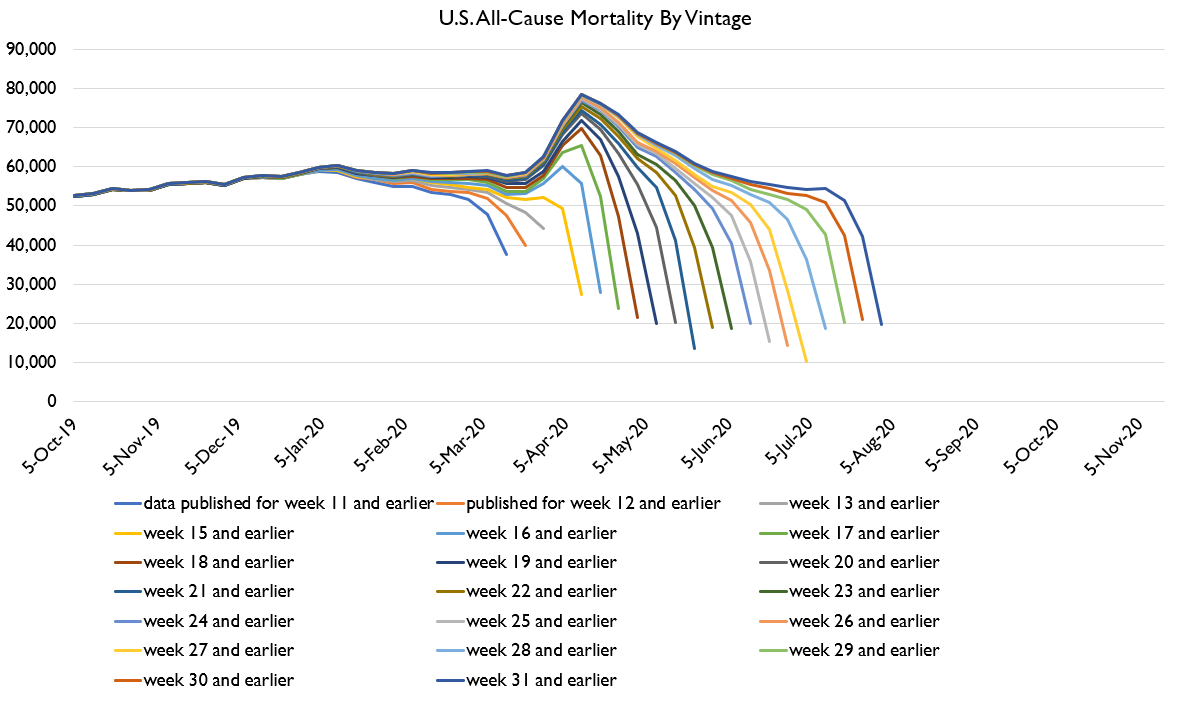
I have been tracking this data for a while now. As a result, I have enough data to characterize the usual pattern of revisions. So for example here's the raw death data over time.
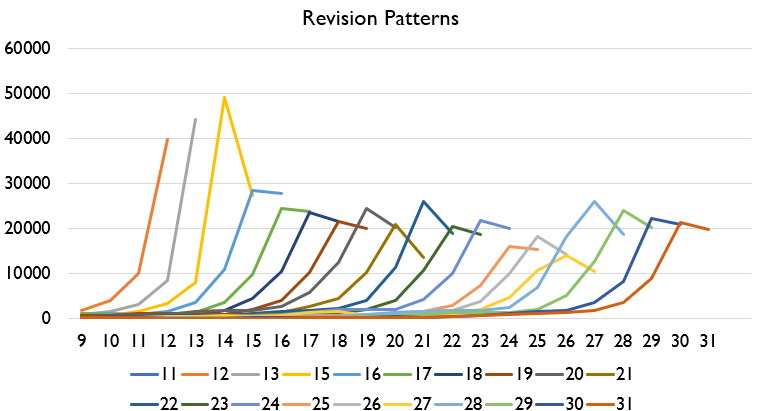
What you can see is a fairly predictable revision pattern. Here's the actual revisions to each week by data release vintage.
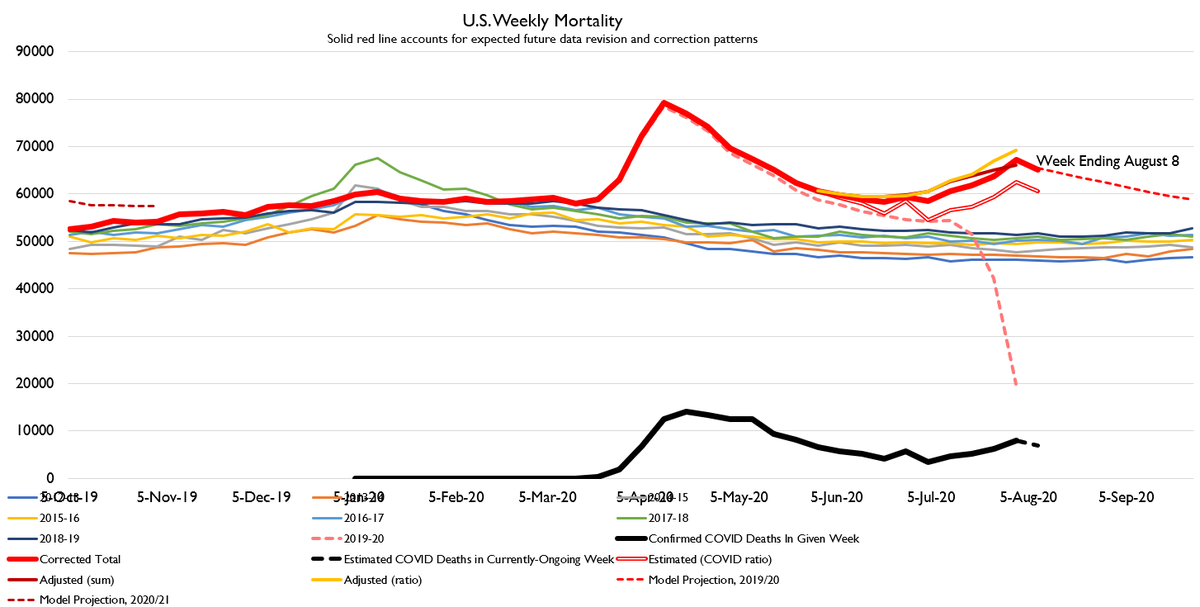
So I build 3 separate models.
1. I *add* expected revisions to incomplete released data
2. I *multiply* incomplete released data by the usual revision *ratio*
3. I take the usual normal death count, and add official COVID deaths to it, with adjustments for timing/reporting
1. I *add* expected revisions to incomplete released data
2. I *multiply* incomplete released data by the usual revision *ratio*
3. I take the usual normal death count, and add official COVID deaths to it, with adjustments for timing/reporting
These three methods produce the three different forecast lines you see. My "corrected estimate" is basically a weighted average of the three.
You can hate it but you've got to admit at least it's an ethos
Anyways you'll notice a NEW ADDITION to this chart. A FORECAST.
I have avoided making forecasts because lol have you seen 2020 this year man
I have avoided making forecasts because lol have you seen 2020 this year man
But I've decided to bite the bullet and calibrate expectations.
Simple method:
I use @youyanggu 's latest estimates of projected future infections,, and apply an IFR calculcated from his historic infection estimates and my excess deaths.
Simple method:
I use @youyanggu 's latest estimates of projected future infections,, and apply an IFR calculcated from his historic infection estimates and my excess deaths.
I project a *falling* IFR in the future as well, though not plummeting.
This method could obviously be wrong. There could be a third wave. A mutation could lead to a higher IFR-strain spreading. Anything could happen!
This method could obviously be wrong. There could be a third wave. A mutation could lead to a higher IFR-strain spreading. Anything could happen!
But so far @youyanggu has been the best (and most transparent!) forecaster out there. And since I'm not an epidemiologist, I'm just gonna adopt his epidemiological forecast and just apply my mortality model to it.
The takeaway here is that *even if there is no 3rd wave*, and also *even if IFRs decline*, and also *even if R values stay low*, we will continue to see elevated death rates until *Thanksgiving*.
Which when I first modeled this out a month ago I was very !!!!!!!!!!!!!!!!!!!!!!!!!!!!!!!!! but now I'm thinking honestly forecasting no 3rd wave seems kinda optimistic but I guess we'll see right
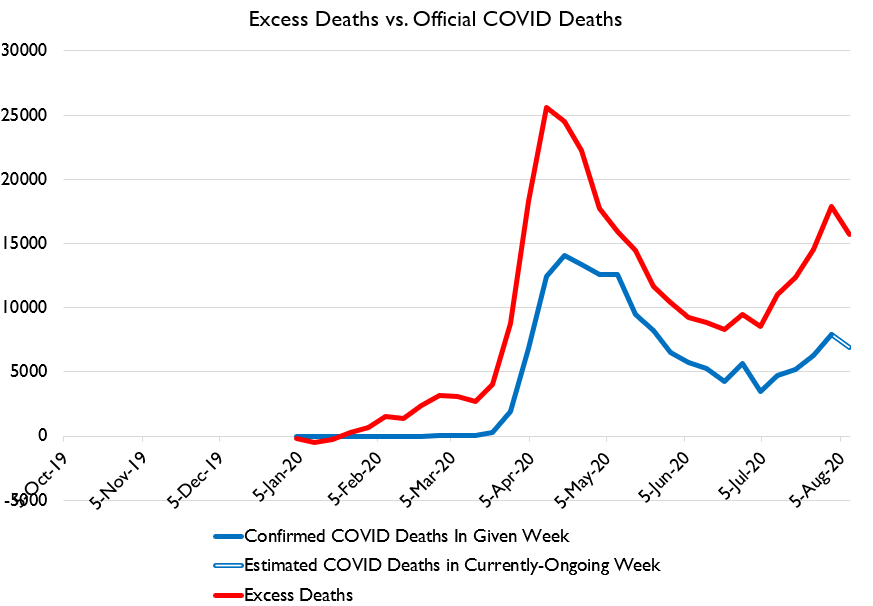
So anyways, here's official COVID deaths vs. excess deaths. What you can see is that there's simply no evidence of over-reporting COVID deaths, and there's no evidence that we've gotten better at "catching" deaths in the official coding system.
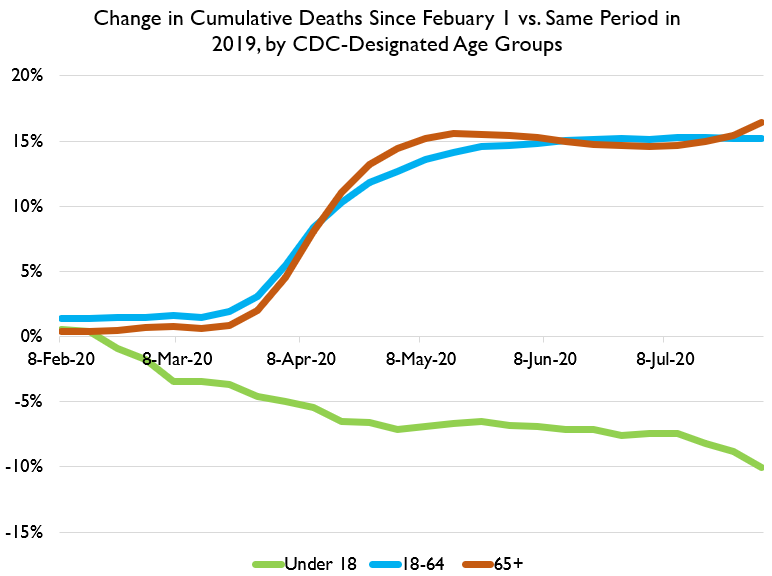
Here's death data broken out by age. Staying at home has saved kids' lives. About 2,200 lives, to be exact.
As it says in the title of the chart, "CDC-designated age groups." That's the most granular I can get. https://twitter.com/Wyman856/status/1291774441651941377
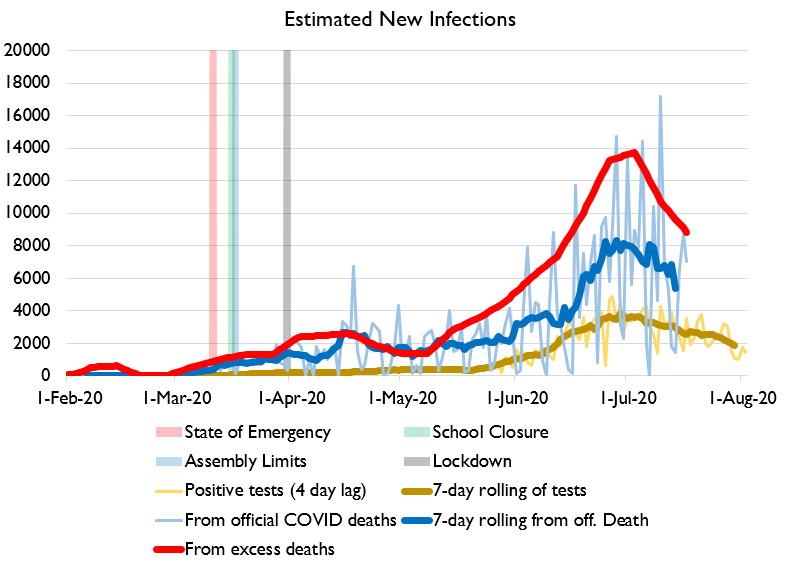
Here's estimated true case counts by various methods. The excess death figure is probably the most accurate in terms of scale, but the official death data is probably more accurate in terms of timing. The epidemic curve is bending down.
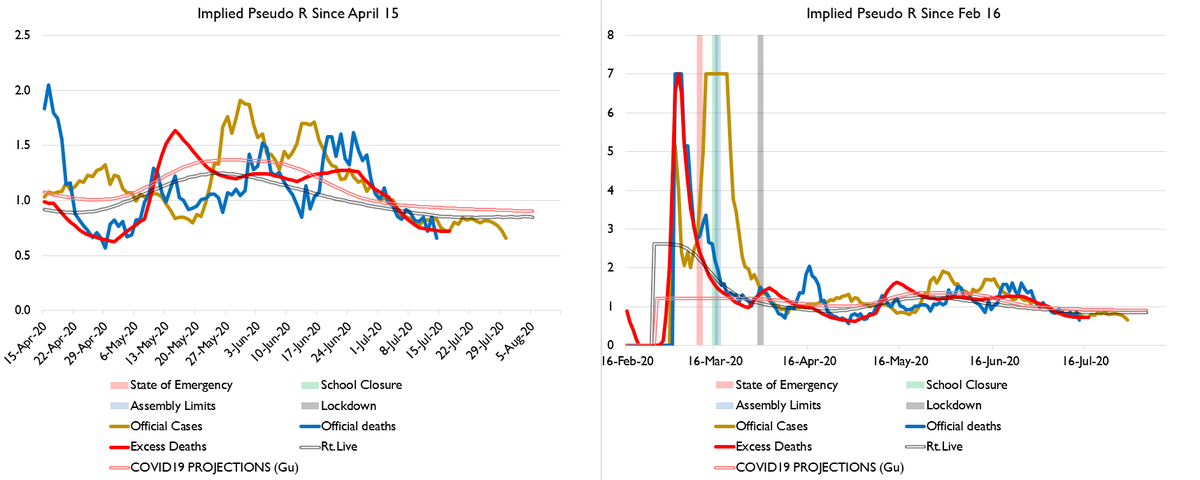
Nationally, all indicators now show an R value below 1.
That's good news folks. Give yourselves a pat on the back.
That's good news folks. Give yourselves a pat on the back.
Let's do states!
We'll start with Arizona since @dougducey and @JoeBiden have been bickering about it.
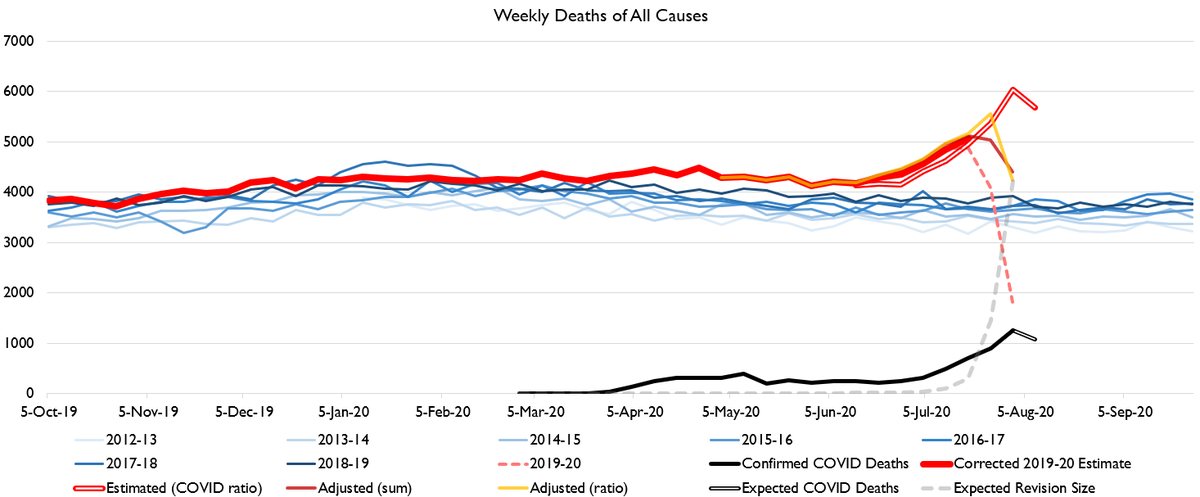
AZ deaths appear to have peaked, by all metrics. Cases falling. R value has been WELL below 1 for several weeks now.
We'll start with Arizona since @dougducey and @JoeBiden have been bickering about it.
AZ deaths appear to have peaked, by all metrics. Cases falling. R value has been WELL below 1 for several weeks now.
Arizona is a failure story ***because they did not impose travel quarantine rules***.
But Arizone is a success story ***because they pushed the R value down very low very fast once the outbreak began***.
But Arizone is a success story ***because they pushed the R value down very low very fast once the outbreak began***.
It took Arizona 42 days from the R value moving over 1 to get it back below 1.
Which is exactly how long it took New York when they had their first wave.
Which is exactly how long it took New York when they had their first wave.
In fact now that I think of it, "days spent with R value >1" is probably a pretty fair and reasonable indicator of epidemic response.
Texas deaths are an interesting story.
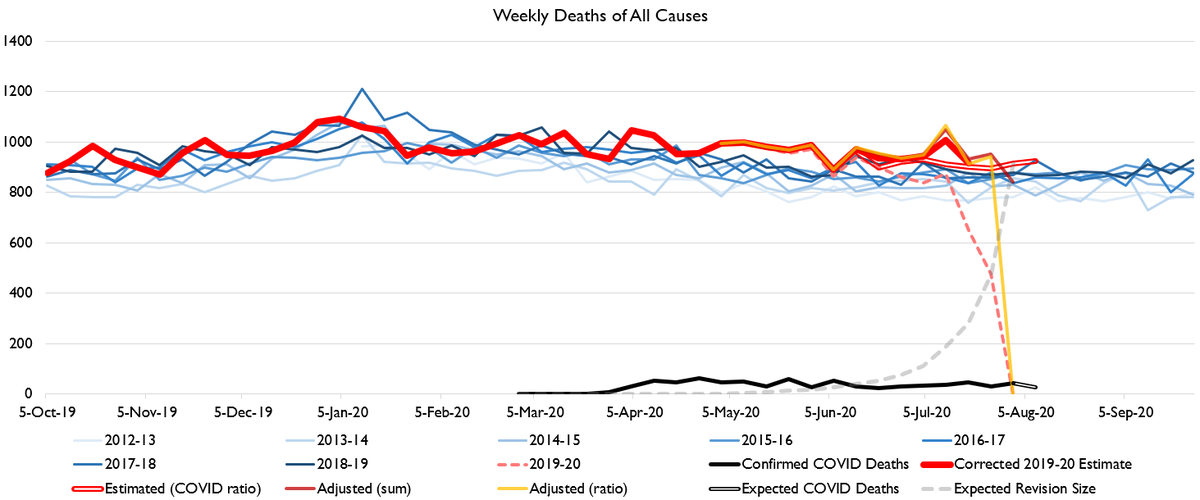
Texas COVID deaths are running a LOT higher than excess deaths in recent weeks. This could mean the pace of TX all-cause has slowed. Or it could mean they're over-classifying as COVID.
Texas COVID deaths are running a LOT higher than excess deaths in recent weeks. This could mean the pace of TX all-cause has slowed. Or it could mean they're over-classifying as COVID.
By my calculation, TExas' R value is about 0.9, and the best epidemiological trackers also have <1, so I don't think this is correct. https://twitter.com/jbee_texasblue/status/1291778360021065728
Same model discrepancy shows up in Florida. It's possible that my model has overtrained on low-death periods for these states so is underestimating the scale of revisions which are incoming, so the figure based on official COVID deaths may be more accurate.
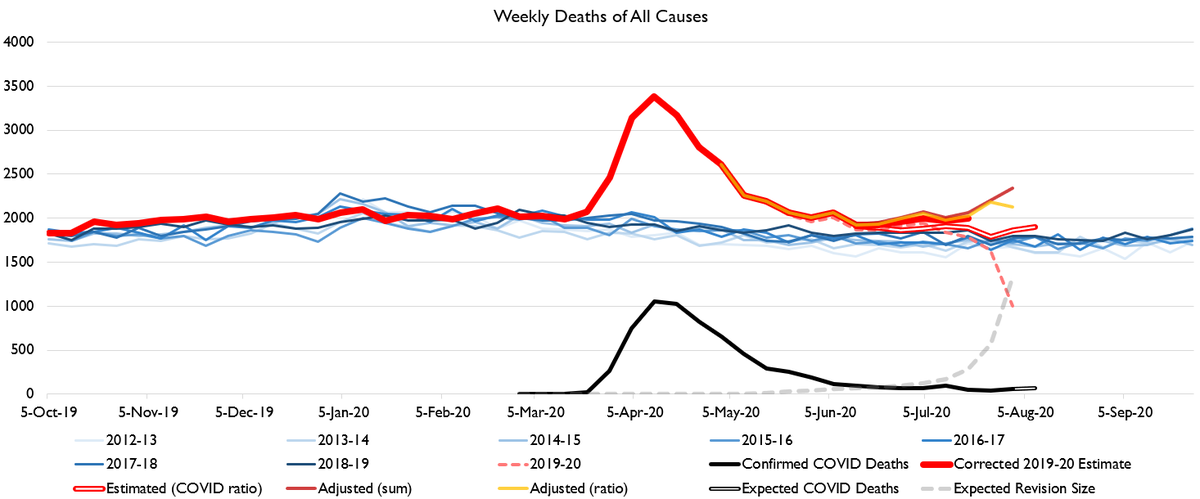
California continues to keep on keepin' on at elevated death rates, but no big spike like we see elsewhere. Kinda odd. But I guess that's what a flattened curve looks like!
The Commonwealth on which the Lord God Almighty looks with favor and delight continues to have extremely limited excess deaths.
That being of course Kentucky.
Michigan may also be headed for a second wave. Unrevised numbers in some back-weeks are already over the COVID-death supplemented count, which suggests revised numbers will exceed in latest weeks too.
lol New York was hit a month after COVID was already a widely publicized threat with bodies piling up in multiple countries and well over a billion people in Asia hunkering down get off my lawn https://twitter.com/gedawei/status/1291780448964603904
"New York gets a pass because WhO cOuLd HaVe PrEdIcTeD tHiS"
lol George Bush. Literally George Bush.
lol George Bush. Literally George Bush.
But seriously we need to stop making apologies for a place that had months to prepare and even when they already had case counts spiraling refused to cancel parades and other activities.
Maine has been my go-to state for "lockdowns don't cause excess deaths" but deaths may now be rising in Maine
Oh also Maine's no longer on lockdown
So it still works!
Oh also Maine's no longer on lockdown
So it still works!
This. Precisely this. The subtext on "New York was so surprising! We had no time to prepare!" is "We assumed COVID could only happen to Asians because Asia" https://twitter.com/HeadwaysMatter/status/1291781877427306505
Anyways Hawaii is still fine.
I got asked for Kansas, which to be honest I always forget that Kansas is a place. I've driven through it dozens of times and even when I drive through it's like "Is this even a real place? Does it really exist? Or is it just my mind creating an imaginary purgatory?"
My basic theory is that the best proxy for COVID deaths is "tourist volume as a ratio of local population." That's pretty much the map of COVID deaths. Even internationally pretty much!
Except Hawaii because Hawaii is apparently magic.
Note that actually Hawaii is not magic. Montana. Alaska. Hawaii. Kentucky. West Virginia. Kansas. The Dakotas.
We're all pretty much just chugging along without much in the way of excess deaths.
We're all pretty much just chugging along without much in the way of excess deaths.
The "island effect" is real but it's not actually due to being an island. It's due to having very few interstate travelers. Same applies to Hong Kong or Taiwan. Effective COVID-fighting boils down to extensive travel restrictions.
That's it. That's basically the strategy. Close the airports and seal the interstates.
Suzie has now been granted early parole for good behavior from Baby Prison ergo tweets gonna pause for a bit while she gets her lai lai
I wish to register a grievance before going on.
The fact that Canada outlaws baby walkers is heinous and terrible. Almost nothing in Suzie's life gives her more joy (and her parents more flexibility in terms of childcare + work) than her baby walker.
The fact that Canada outlaws baby walkers is heinous and terrible. Almost nothing in Suzie's life gives her more joy (and her parents more flexibility in terms of childcare + work) than her baby walker.
"but she could roll down stairs"
yes
so put up a baby fence or close the door
yes
so put up a baby fence or close the door
"but she could roll down a hill"
yes
we have rolled her down the hill
she absolutely loves it and she's never actually out of arm's reach or in any danger
how is that even a con
yes
we have rolled her down the hill
she absolutely loves it and she's never actually out of arm's reach or in any danger
how is that even a con
"it could delay her acquisition of mobility"
yes
again how is that a con what parent wants their kid to be mobile sooner !?!?!?
yes
again how is that a con what parent wants their kid to be mobile sooner !?!?!?
Her greatest joy is while I'm sitting in the kitchen to have me kick her walker across the kitchen, then scoot back to me, rinse and repeat. Happy baby for HOURS.

 Read on Twitter
