Two cheers for the July jobs report. A 7-digit monthly payroll growth number sounds great...until you realize we had an 8-digit loss in April we're still trying to recover from, and the pace of hiring has slowed. https://www.washingtonpost.com/opinions/2020/08/07/two-cheers-july-jobs-report-just-two/
Slowdown is concerning, as it occurred before the $600 UI benefit even expired. And that $600 was keeping a lot of laid-off households (and the businesses they patronize) afloat. https://twitter.com/p_ganong/status/1289213391203180545
State/local govts are also broke, and federal relief remains uncertain. July report showed those payrolls up but really an artifact of screwy seasonal adjustment issues (usual July layoffs got pulled forward b/c of pandemic). From BLS report
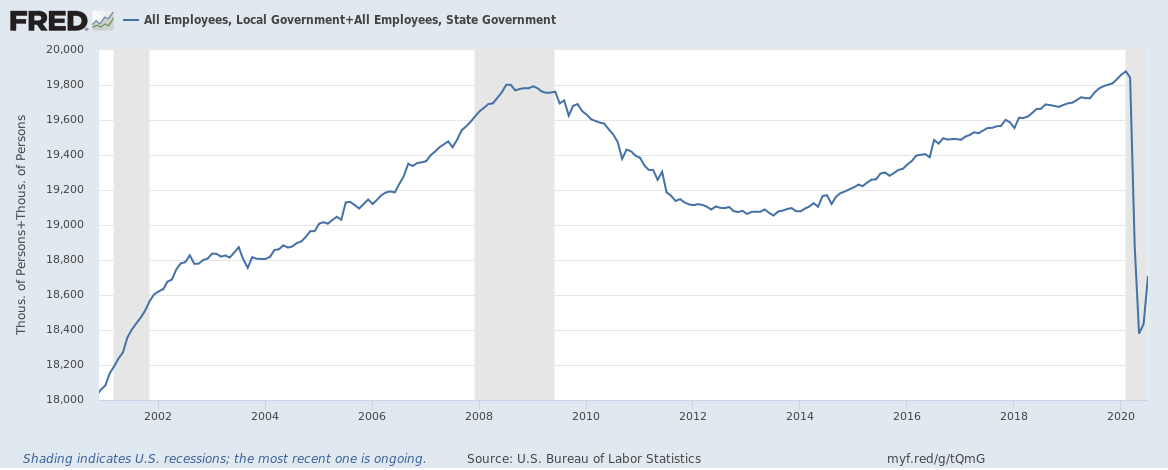
State/local governments have shed 1.6 million jobs since February. For comparison: After the financial crisis, the total net decline in state and local government jobs was about 750,000 — and that was over the course of *five years.* Without federal help, more layoffs coming
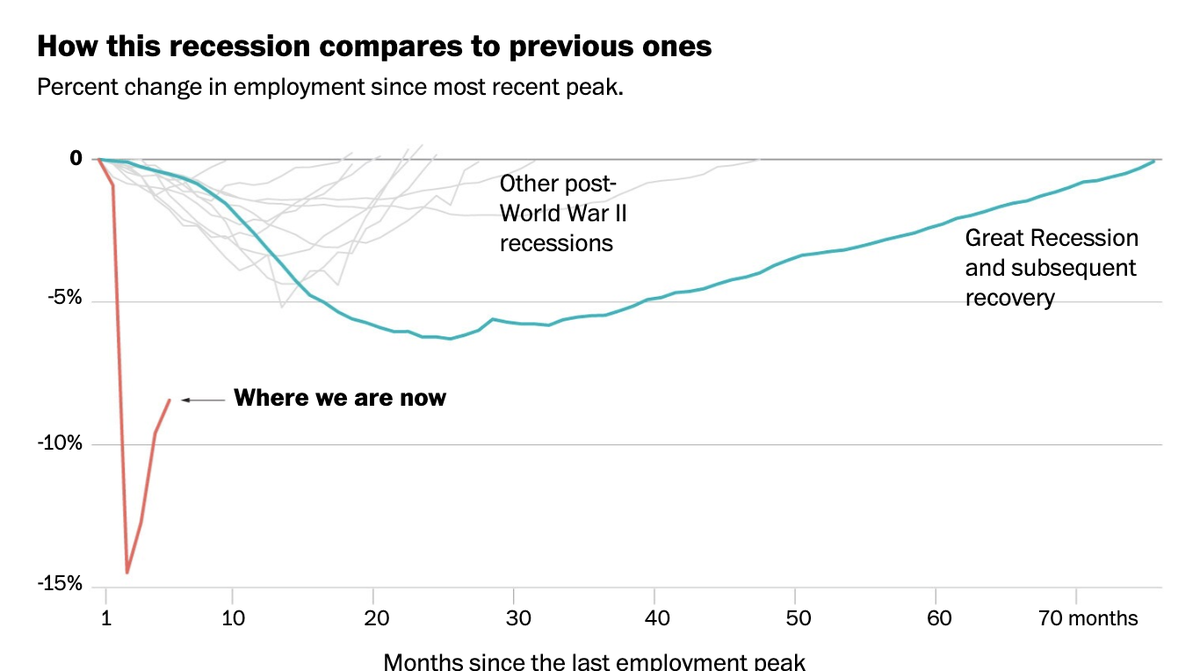
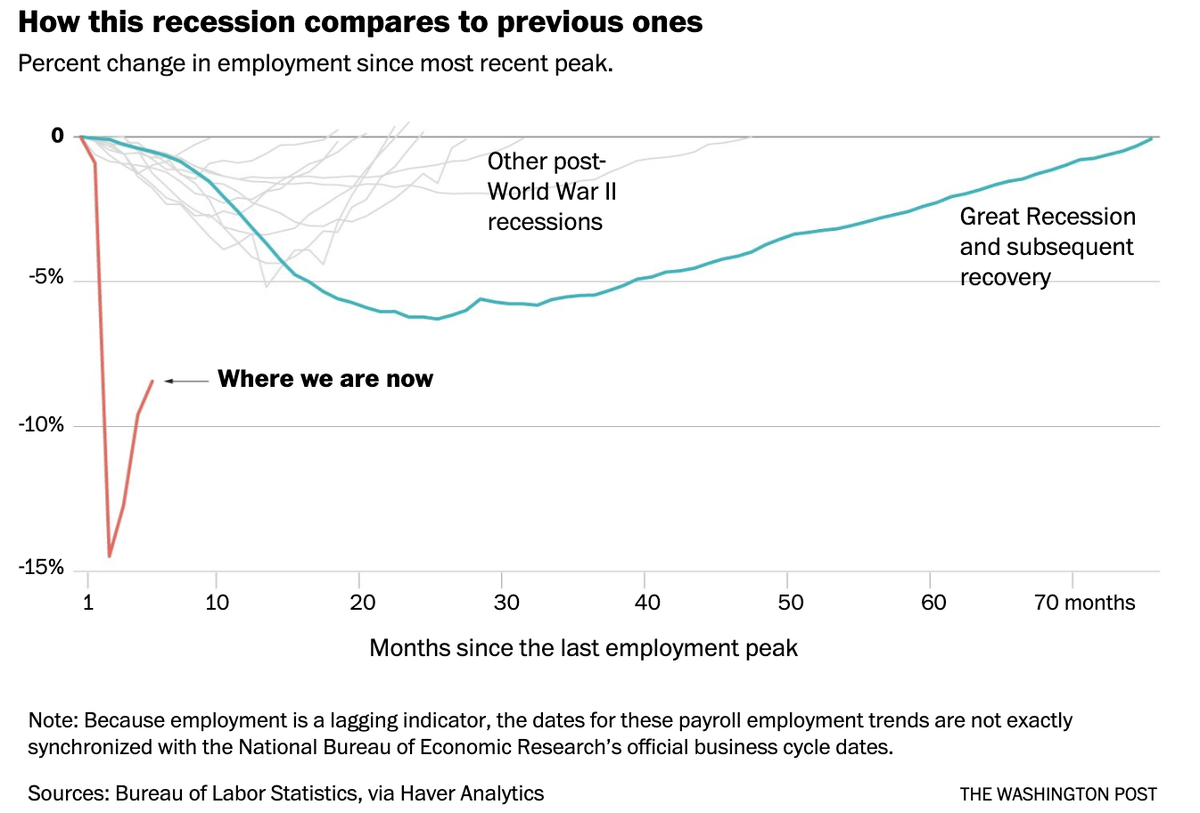
BTW I have been doing a version of this chart on & off for over a decade. Initial purpose of the chart was to show how bad the Great Recession (teal line) was. Now Great Recession trend looks comparatively boring. Recent declines (red) so much worse the chart needed longer y-axis

 Read on Twitter


