New publication in @JACCJournals:
south asians suffer from high rates of coronary disease vs other races
we validate a polygenic score that identifies 5% of South Asians with >3x risk
@MGHHeartHealth @broadinstitute @MassGeneralNews @JACCJournals
https://bit.ly/2XEMs1x
south asians suffer from high rates of coronary disease vs other races
we validate a polygenic score that identifies 5% of South Asians with >3x risk
@MGHHeartHealth @broadinstitute @MassGeneralNews @JACCJournals
https://bit.ly/2XEMs1x
South Asians account for 23% of the global population — nearly 2 billion people —
but only 1.8% of participants in genetic association studies to date
and almost no prior studies have studied a genetic risk predictor in a South Asian population
but only 1.8% of participants in genetic association studies to date
and almost no prior studies have studied a genetic risk predictor in a South Asian population
Using results from a large GWAS — 77% European ancestry and only 13% South Asians
We derive a a polygenic score using 7K South Asians in
@uk_biobank
and validate using new whole genome sequencing data in a Bangladeshi study led by @aidanbutty and @rajeevgg
We derive a a polygenic score using 7K South Asians in
@uk_biobank
and validate using new whole genome sequencing data in a Bangladeshi study led by @aidanbutty and @rajeevgg
The genome-wide polygenic score — inclusive of > 6 million variants
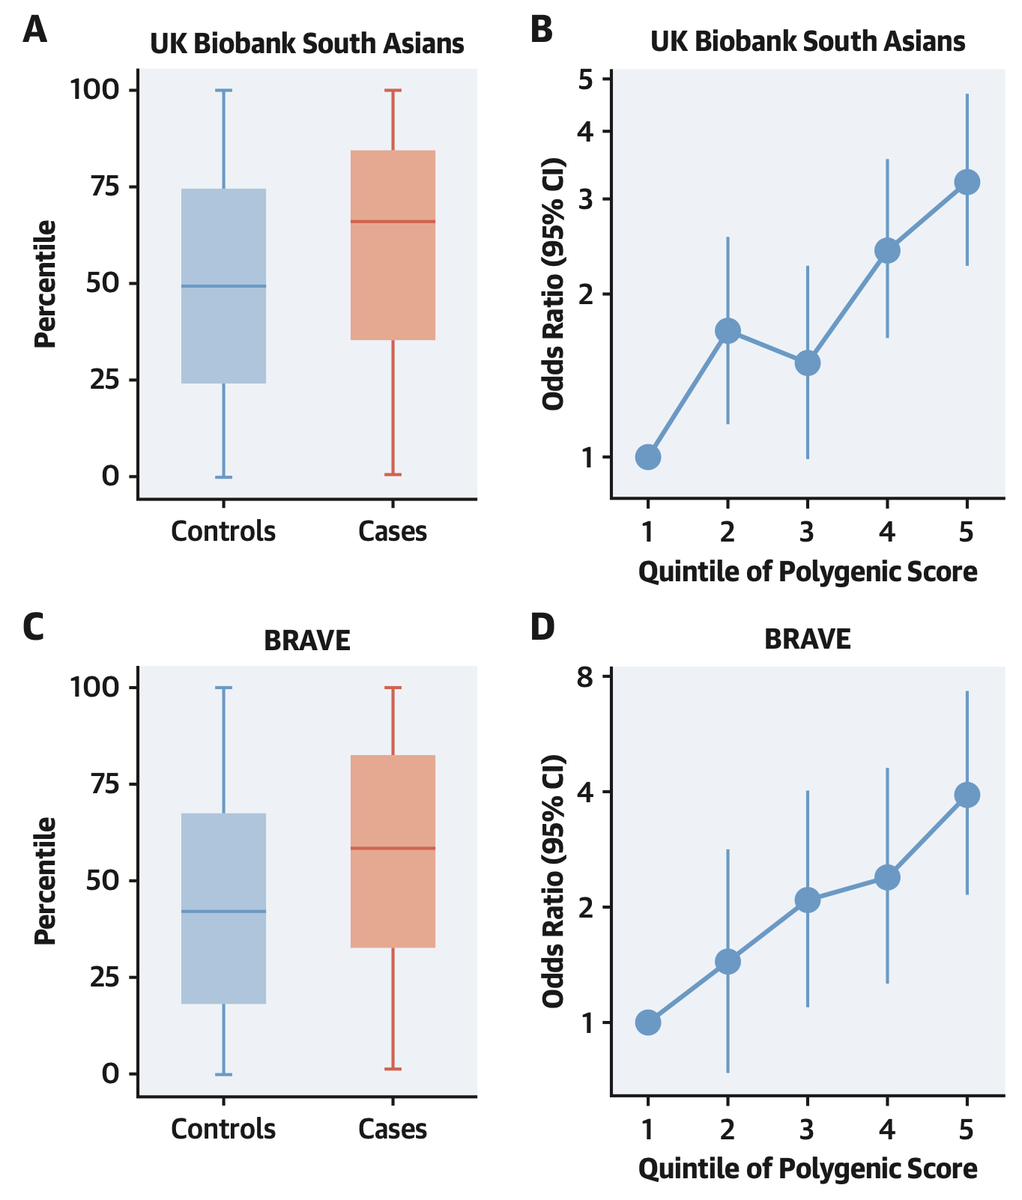
demonstrated performance approaching what we previously observed in European ancestry individuals
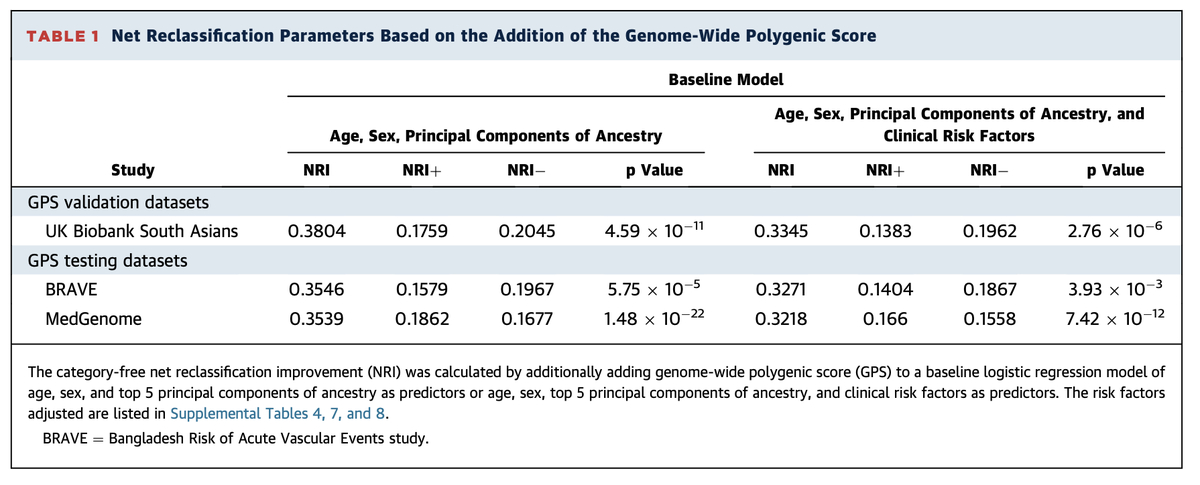
and significantly improved reclassification within the case-control study design
demonstrated performance approaching what we previously observed in European ancestry individuals
and significantly improved reclassification within the case-control study design
But calculation of a polygenic score is complicated
a) distributions vary by ancestry
b) how to know what score is high or low?
we turned to the GenomeAsia study— a new population genetics resource with whole genome sequencing in >1500 Indians
to make a reference distribution
a) distributions vary by ancestry
b) how to know what score is high or low?
we turned to the GenomeAsia study— a new population genetics resource with whole genome sequencing in >1500 Indians
to make a reference distribution
This reference population static, so it allows us to:
a) project any newly recruited individual onto a quantitative ancestry space,
so the polygenic score is compared to others with similar background
and
b) provides us with an ancestry-specific reference distribution
a) project any newly recruited individual onto a quantitative ancestry space,
so the polygenic score is compared to others with similar background
and
b) provides us with an ancestry-specific reference distribution
With @MedGenomeLabs, we studied 3,000 coronary artery disease cases or controls in India
cases were in the 64th % of the distribution and oods ratio of top versus bottom quintile ~4
Top 5% versus middle quintile >3x risk
and not captured by clinical risk factors
cases were in the 64th % of the distribution and oods ratio of top versus bottom quintile ~4
Top 5% versus middle quintile >3x risk
and not captured by clinical risk factors

 Read on Twitter


